|
Related Topics |
|
Last Updated: 18 February 2020
This page will take a look at South Africa's inbound tourism numbers as well as income earned from the Tourism industry in South Africa. It aims to answer the question, where does South Africa's tourists come from and where and what type of accommodation do they use when they are in South Africa.
The page will be updated on an ad hoc basis as more information becomes available. The main data source: Statistics South Africa |
|
18 February 2020: Tourist accommodation data for December 2019
Statistics South Africa published the latest tourist accommodation information for the month of December 2019 for South Africa. So how much money was spent on tourist accommodation during the festive period? And how much money was spent at restaurants and bars during the December holidays in South Africa. Below a summary of the latest tourist accommodation survey published by Statistics South Africa
In total just over 2 million stay nights were booked in South Africa during December 2019. With the average income per stay night equaling R1 235.90, which amounted to income from accommodation for the tourism industry in South Africa during December 2019 equaling R2.496 billion. People spent R734 million at restaurants and bars during December 2019. That must have led to loads of headaches, hangovers and significant weight gains for a large number of people during the festive period.
- Stay units available: 127 000
- Stay unit nights sold: 2 020 200
- Occupancy rate (%): 51.3
- Average income per stay unit night sold : R1 235.9
- Total income:R 4 764 100 000
- Income from accommodation:R 2 496 765 180
- Income from restaurant and bar sales:R 734 000 000
- Other income:R 1 533 300 000
In total just over 2 million stay nights were booked in South Africa during December 2019. With the average income per stay night equaling R1 235.90, which amounted to income from accommodation for the tourism industry in South Africa during December 2019 equaling R2.496 billion. People spent R734 million at restaurants and bars during December 2019. That must have led to loads of headaches, hangovers and significant weight gains for a large number of people during the festive period.
2 December 2019: SA tourism trade balance edges lower
The article below from Statistics South Africa discusses the latest regarding South Africa's tourism trade balance as derived from the latest Tourism Satellite Accounts (TSA) report published by Statistics South Africa last week.
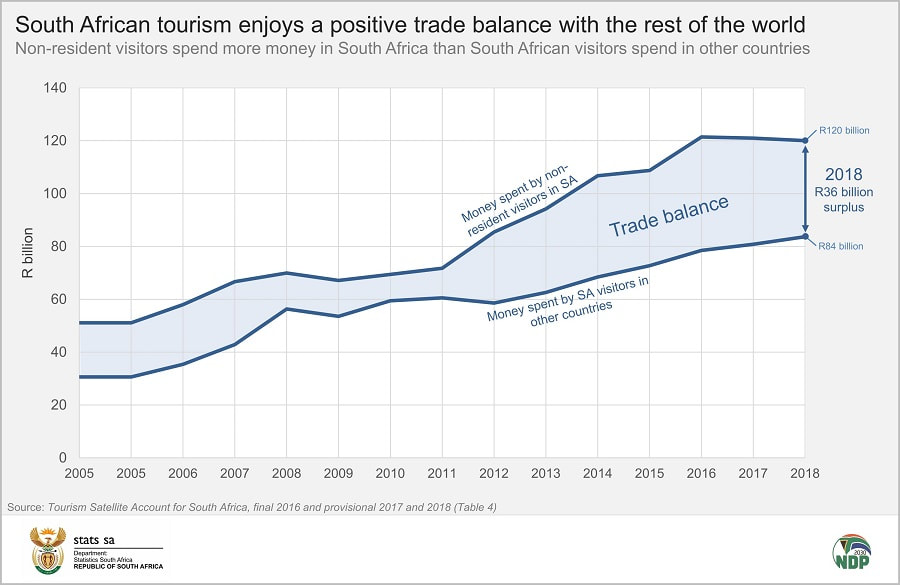
South Africa enjoys a positive tourism trade balance with the rest of the world. What this means is that non-resident visitors spend more money in our country than South African travellers spend abroad. However, the trade balance surplus has narrowed since 2016. In 2018, non-resident visitors (which includes both tourists and same-day visitors) spent a total of R120 billion within the borders of South Africa. This is according to data from the latest Tourism Satellite Account for South Africa (TSA) report. Much needed foreign currency is traded for rands, and visitors spend this on a range of tourism-related activities, such as accommodation, transport, food and recreation.
South Africans, on the other hand, offset this by taking money out of the country when they travel internationally. Every time you take out your credit card to pay for a meal at a London pub, or order an Uber ride in downtown Bangkok, you are transferring a small amount of money out of South Africa. The total amount of money spent by South African visitors abroad was R84 billion in 2018. Illustrated in the graph below, the difference between these two figures gives South Africa’s tourism trade balance with the rest of the world. The country had a positive tourism trade balance of R36 billion in 2018.
South Africa's Tourism enjoys a positive trade balance with the rest of world
In other words, the country earns more currency from tourism-related activities than it spends in other countries. A positive tourism trade balance also has a positive impact on South Africa’s overall trade balance. From 2011 to 2016, the tourism trade balance shifted more in South Africa’s favour. There was a surplus of R11 billion in 2011, increasing to R43 billion in 2016.
Since 2016, the tourism trade surplus has fallen. If you look at the top line in the graph, you will notice a slight drop in non-resident visitor expenditure for both 2017 and 2018. In other words, non-resident visitors have spent less in South Africa since 2016. South Africans travelling abroad, however, increased their expenditure over the same period.
The small drop-off in non-resident visitor spending mirrors the essentially flat pattern in the number of foreign visitors during 2016–2018. In 2015, 13,9 million foreign visitors arrived at the country’s ports of entry.2 This jumped by 8,4% to 15,1 million in 20163, but thereafter the number levelled out, with 14,9 million arriving in 20174 and 15,0 million arriving in 2018.
In his address to delegates at the 2019 Africa’s Travel Indaba, President Cyril Ramaphosa referred to tourism as the new gold. This was to highlight tourism’s importance in growing economies across Africa.6 According to the TSA report, tourism contributed 2,7% to South Africa’s gross domestic product (GDP) in 2018 and provided jobs for 739 657 individuals, or 4,5% of the country’s total employed. Growing the tourism sector involves a range of initiatives, one of which is to attract foreign visitors to our shores.
29 November 2019: Tourism Satellite Accounts data
The extract below comes from the latest Tourism satellite accounts publication as published by Statistics South Africa
The tourism sector directly employed 739 657 persons in 2018, an increase of 8,5% or 58 038 employees compared with 2017. The tourism share of total employment increased from 2017 (4,2%) to 2018 (4,5%). The year 2018 saw 15 004 384 non-resident visitors to South Africa compared with 14 975 675 non-resident visitors in 2017 and 15 121 328 non-resident visitors in 2016. Of the 15 004 384 non-resident visitors in 2018, 4 532 279 (or 30,2%) were same-day visitors and 10 472 105 (or 69,8%) were tourists.
For tourism consumption (expenditure), the trends in 2018 (compared with 2017) were:
Tourism exports (inbound tourism expenditure) decreased by 0,8% to R120 037 million compared with a 0,3% decline in the previous period;
Tourism imports (outbound tourism expenditure) increased by 3,5% to R83 673 million compared with 3,0% growth in the previous period;
Domestic tourism expenditure increased by 17,6% to R153 196 million compared with a 9,4% decrease in the previous period; and
Internal tourism expenditure increased by 8,8% to R273 233 million compared with a 5,3% decrease in the previous period. Inbound tourism expenditure totalling R120 037 million was recorded in 2018.
The main expenditure items were 'non-specific products' (22,5%), 'accommodation for visitors' (15,9%), 'connected products' (14,8%) and 'air passenger transport services' (12,9%). Domestic tourism expenditure totalling R153 196 million (including the domestic portion of outbound tourism expenditure) was recorded in 2018. The main expenditure items were 'road passenger transport services' (28,4%), 'air passenger transport services' (15,9%), 'accommodation for visitors' (15,3%) and 'non-specific products' (12,2%). The total internal tourism consumption in cash for South Africa in 2018 was R273 233 million (inbound tourism consumption R120 037 million [43,9%] and domestic tourism consumption R153 196 million [56,1%]). The main expenditure items for internal tourism were 'road passenger transport services' (21,3%), 'non-specific products' (16,7%), 'accommodation for visitors' (15,5%) and 'air passenger transport services' (14,6%).
19 August 2019: Occupancy rate of different accommodation types
We take a look at the latest occupancy rates as reported by the Tourist Accommodation survey published by Statistics South Africa. We decided to look at the occupancy rate of accomodation types in South Africa following the release of City Lodge Hotel Group financial results in which the group stated that they had an occupancy rate of 58%.
Other accommodation includes lodges, bed and breakfasts and other self catering accommodation as well as accommodation types not elsewhere classified.
- Other accommodation: 68%
- Total industry: 53.8%
- Hotels: 52.1%
- Caravan parks and camping sites: 36.4%
- Guest houses and guest farms: 40.1%
Other accommodation includes lodges, bed and breakfasts and other self catering accommodation as well as accommodation types not elsewhere classified.
Advertisment
28 May 2019: Inbound tourists into South Africa from North America for Q1:2019
In this update we take a look at the number of inbound tourists into South Africa from North America (basically the United States of America and Canada) per month for the first quarter of 2019.
The bar chart below shows the three months of quarter 1, 2019 as well as the number of inbound tourists for each of these months for both Canada and the United States.
The bar chart below shows the three months of quarter 1, 2019 as well as the number of inbound tourists for each of these months for both Canada and the United States.
So has the number of inbound tourists from North America grown over the last year? Is tourism really one of the industries that can kick start South Africa's economy and is it currently doing that? Below a summary of the growth rates of inbound tourism numbers from North America for the first quarter of 2019:
In total the number of tourists from Canada for the first quarter of 2019 amounted to 19 224 people while 83 185 tourists arrived in South Africa during the first quarter of 2019 from the United States of America.
So the total number of inbound tourists from North America as a whole increased by 1.4% in total from quarter 1, 2018 to quarter 1, 2019. Growth in tourism numbers from North America not exactly shooting the lights out. And if it remains at the current low to no growth we cannot see how Tourism will be one of the industries that revives South Africa's economy. Sadly rampant crime and violence is a big issue that keeps thousands of potential tourists from across the world away from visiting South Africa. So until such time as elevated crimes levels are addressed we doubt Tourism will be savior industry of the South African economy.
- Canada: 3.2%
- United States: 0.9%
In total the number of tourists from Canada for the first quarter of 2019 amounted to 19 224 people while 83 185 tourists arrived in South Africa during the first quarter of 2019 from the United States of America.
So the total number of inbound tourists from North America as a whole increased by 1.4% in total from quarter 1, 2018 to quarter 1, 2019. Growth in tourism numbers from North America not exactly shooting the lights out. And if it remains at the current low to no growth we cannot see how Tourism will be one of the industries that revives South Africa's economy. Sadly rampant crime and violence is a big issue that keeps thousands of potential tourists from across the world away from visiting South Africa. So until such time as elevated crimes levels are addressed we doubt Tourism will be savior industry of the South African economy.
27 May 2019: Inbound tourist into South Africa from Europe for March 2019
In this update we take a look at the number of inbound tourists into South Africa from Europe for the month of March 2019. The number of inbound tourists include all visitors be it for holiday, studies, work or medical reasons. The countries are ranked from most visitors to least amount of visitors for the month of March 2019. In total 146 833 tourists visited South Africa from Europe during March 2019:
- UK: 42 772
- Germany: 33 940
- France: 17 451
- The Netherlands: 10 364
- Belgium: 4 689
- Switzerland: 4 658
- Italy: 4 305
- Sweden: 3 796
- Portugal: 2 987
- Ireland: 2 908
- Austria: 2 802
- Spain: 2 759
- Denmark: 2 263
- Russian Federation: 1 631
- Norway: 1 479
- Poland: 1 314
- Turkey: 1 139
- Finland: 1 087
- Czech Republic: 854
- Hungary: 589
- Greece: 556
- Romania: 329
- Slovakia: 321
- Ukraine: 311
- Bulgaria: 220
- Lithuania: 177
- Slovenia: 162
- Cyprus: 131
- Serbia: 131
- Luxembourg: 126
- Croatia: 104
- Estonia: 92
- Iceland: 81
- Malta: 60
- Latvia: 57
- Republic of Belarus: 47
- Georgia: 32
- Liechtenstein: 28
- Bosnia-Herzegovina: 20
- Albania: 18
- Macedonia: 17
- Moldova: 12
- Montenegro: 6
- Monaco: 5
- Andorra: 3
20 May 2019: Tourist Accommodation statistics
In this update we take a look at the latest tourist accommodation numbers as published by Statistics South Africa (Stats SA) and focus on the occupancy rates of various accommodation types as well as focus on the average Rand value charged per 1 night stay for the various accommodation types available.
Occupancy rate (as at March 2019):
Average Rand amount charged per night (as at March 2019):
So other accommodation had the highest occupancy rate and charged the highest Rand value per night stay as at March 2019. Other accommodation according to Stats SA includes lodges, bed-and-breakfast establishments, self-catering establishments and ‘other’ establishments not elsewhere classified. One wonders what percentage of "other accommodation" is made up by AirBnB units?
Occupancy rate (as at March 2019):
- Hotels: 52.3%
- Caravan parks and camping sites: 36.9%
- Guest-houses and guest-farms: 44.1%
- Other accommodation: 62.4%
Average Rand amount charged per night (as at March 2019):
- Hotels: R1 117.50
- Caravan parks and camping sites: R326.10
- Guest-houses and guest-farms: R 1 123.60
- Other accommodation: R1 176.00
So other accommodation had the highest occupancy rate and charged the highest Rand value per night stay as at March 2019. Other accommodation according to Stats SA includes lodges, bed-and-breakfast establishments, self-catering establishments and ‘other’ establishments not elsewhere classified. One wonders what percentage of "other accommodation" is made up by AirBnB units?
14 March 2019: How do tourists spend their money?
In this update we take a look at a article published by Statistics South Africa regarding what tourists both domestic and international spend their money on.
Article Starts
Fancy a meal out, or would you rather save up for accommodation when on holiday? We take a peek into the spending habits of domestic and international visitors who criss-cross the South African landscape. Visitors spent just over half a million rand every minute during the course of 2017! That amounts to R277 billion for the entire year, according to the latest Tourism Satellite Account for South Africa report. Domestic visitors were the biggest spenders, pumping R156 billion (or 56%) into the economy, while international visitors contributed the remaining R121 billion (or 44%). A little digging into domestic visitor expenditure reveals that local explorers focused their spending on road passenger transportation (taking up 27% of the R156 billion), followed by non-specific products. These are products that visitors buy that are not specifically related to tourism-characteristic activities. Retail (‘shopping’) products fall into this category. Air transport was ranked as the 3rd most important item in the domestic visitor’s budget, contributing 15% to total spending in 2017 (click on the image to enlarge).
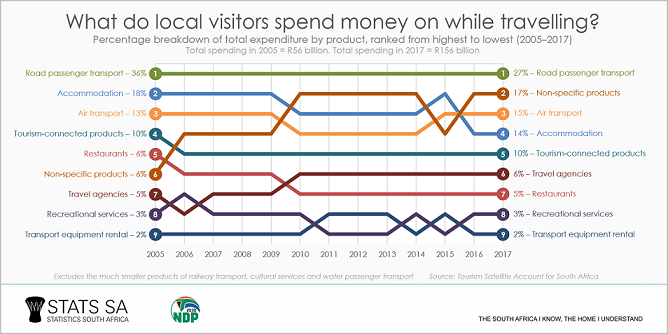
The beautiful thing about this analysis is that annual data are available from as far back as 2005, showing how domestic visitors have shifted their habits over time. Road passenger transportation was also ranked #1 in 2005, but this item took up 36% of total domestic expenditure then, higher than the 27% recorded in 2017. Accommodation was the second-most important item in 2005, falling to 4th place in 2017. The major mover, however, was non-specific products, shifting from 6th place in 2005 to 2nd spot in 2017.
Non-resident visitors gracing our shores have slightly different spending priorities. The major spending item for international visitors is non-specific products, followed by accommodation and tourism-connected products.5 Road passenger transportation was the fourth-most important expenditure item.
Non-resident visitors gracing our shores have slightly different spending priorities. The major spending item for international visitors is non-specific products, followed by accommodation and tourism-connected products.5 Road passenger transportation was the fourth-most important expenditure item.
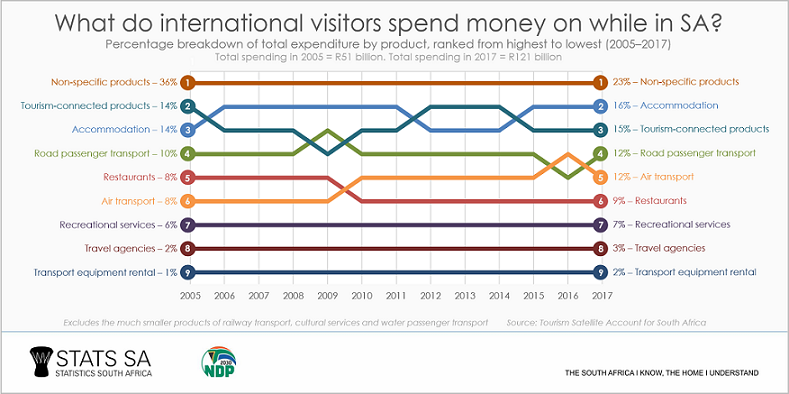
The spending habits of international visitors have remained more stable over time, with little change happening from 2005 to 2017.So next time you pack the car or board a plane to go exploring our country on holiday, take pride in the fact that you are making an important contribution to our economy.
Article Ends
Article Ends
26 February 2019: December 2018 inbound tourism numbers into South Africa
The bar chart below shows the top 30 countries from which South Africa received holiday tourist numbers for December 2018 (African countries are excluded from this analysis). Added to that we take a look at those same countries and how many people came to South Africa from these countries during December 2018 to do business. But good luck with that as the majority of South Africans switch off during the month of December and take things easy and unwind during the last month of the year.
Surprisingly the bulk of the inbound tourists arriving in South Africa for holiday purposes arrived from the United Kingdom (take the lead from the main supplier of tourists to South Africa, Germany). Even more surprising is the fact that the USA supplied the second most number of inbound tourists arriving in South Africa for holiday purposes. Germany came in, in third spot. Below a summary of the Top 30 countries as well as the number of tourists that arrived for holiday purposes during December 2018.
So how many tourists from the countries above arrived for business purposes? The summary below shows the number of people from the Top 30 countries that supplied holiday tourists that arrived here for business purposes:
- UK: 52 339
- USA: 37 314
- Germany: 34 203
- The Netherlands: 15 029
- France: 14 418
- Australia: 12 805
- Sweden: 9 146
- Canada: 7 641
- India: 7 275
- Brazil: 7 165
- Italy: 6 652
- Switzerland: 6 213
- China: 5 635
- Belgium: 5 492
- Ireland: 4 265
- Portugal: 3 797
- Austria: 3 605
- Spain: 3 196
- Denmark: 2 481
- Mauritius: 2 332
- Norway: 2 301
- Japan: 2 219
- New Zealand: 2 159
- Russian Federation: 2 077
- Israel: 2 029
- South Korea: 1 819
- Pakistan: 1 510
- Finland: 1 490
- Argentina: 1 476
- Singapore: 1 218
So how many tourists from the countries above arrived for business purposes? The summary below shows the number of people from the Top 30 countries that supplied holiday tourists that arrived here for business purposes:
- UK: 643
- USA: 466
- Germany: 407
- India: 310
- China: 283
- France: 223
- The Netherlands: 171
- Italy: 126
- Japan: 78
- Australia: 72
- Sweden: 66
- Belgium: 65
- Canada: 61
- Switzerland: 44
- Israel: 44
- Spain: 41
- Ireland: 40
- Russian Federation: 38
- South Korea: 35
- Pakistan: 35
- Mauritius: 34
- Portugal: 33
- Austria:31
- Norway:31
- Denmark:28
- Brazil:27
- Finland:21
- New Zealand:17
- Singapore:12
- Argentina:8
27 July 2018: Inbound and outbound tourism numbers between SA and Australia
In this update we take a look at the inbound and outbound tourism numbers between South Africa and Australia. While Statistics South Africa collects and published inbound tourist numbers (tourists coming into the country), they do not publish numbers on South African tourists leaving the country and where they are heading. Luckily for us, the Australian Bureau of Statistics (ABS) collects numbers on their inbound tourist, from which we can see how many South Africans head to Australia for tourist purposes. The graphic below compares the number of tourists from South Africa heading to Australia per month to the number of tourists from Australia heading to South Africa each month.
And even though the Australian population is far smaller than that of South Africa, their tourism numbers coming into South Africa is far greater than South African tourists heading to Australia. Perhaps one of the clearest signs of the difference in wealth and overall living standards between the two countries, as the average Australian has far greater means at his/her disposal to allow travel. Even though South Africa's population is far greater than that of Australia, the number of people that can afford travel is far less.
One does see a massive spike in the number of tourists from both countries during the month of December for the year end holidays, especially for South Africans heading to Australia. No doubt a large number of these tourists head to Australia to see famous sites such as the Sydney harbour bridege, the Opera house, Bondi Beach, Great barrier reef and of course a lot of South Africans head to Australia each year to see expat South Africans living in Australia.
21 May 2018: Occupancy rates of various tourist accommodation types
The graphic below shows the occupancy rates recorded by the various accommodation types as well as the Total Industry occupancy rate achieved per year for the last 12 years.
From the above graphic it is clear that "Öther" and "Guest houses and guest farms " consistently achieve occupancy rates above the total industry average. While the occupancy rate for Caravan parks and camping sites are by far the lowest of the different types, it has seen a massive surge in rates in recent years (as consumers struggle and cut back on expenses and go for cheaper holidays that Caravan Parks and camp sites provide).
For those wondering what "Other" includes, it includes self-catering units, bed-and breakfasts, lodges an other accomodation not covered by any of the accommodation types. "Other" accommodation has by far the highest occupancy so far in 2018, and has been the leading accommodation type in terms of occupancy rates from 2014.
Interestingly that over the last 12 years, the overall total industry occupancy rate hardly changed, except a slight dip in occupancy rates from 2010 to 2012, thanks to the recession set on by the financial crisis in the USA. South African consumers opted for "stay cations" or stay at home vacations in order to save money during tough economic times.
A summary of the occupancy rates (ranked from highest to lowest) by accommodation type is shown below:
- Other: 56.5%
- Guest houses and guest farms: 48.6%
- Total Industry: 47.2%
- Hotels: 44.5%
- Caravan Parks and Camping Sites: 41.1%
28 March 2018: Tourism Satellite Accounts (TSA) data
In today's update of our Tourism page we take a look at some of the numbers published by Statistics South Africa in their Tourism Satellite accounts data.
We often hear that Tourism makes up a significant part of South Africa's economy, and that it is targeted by government as one of the major industries for future economic growth of South Africa (however with extremely and persistently high crime levels we not sure how they plan to make that work).
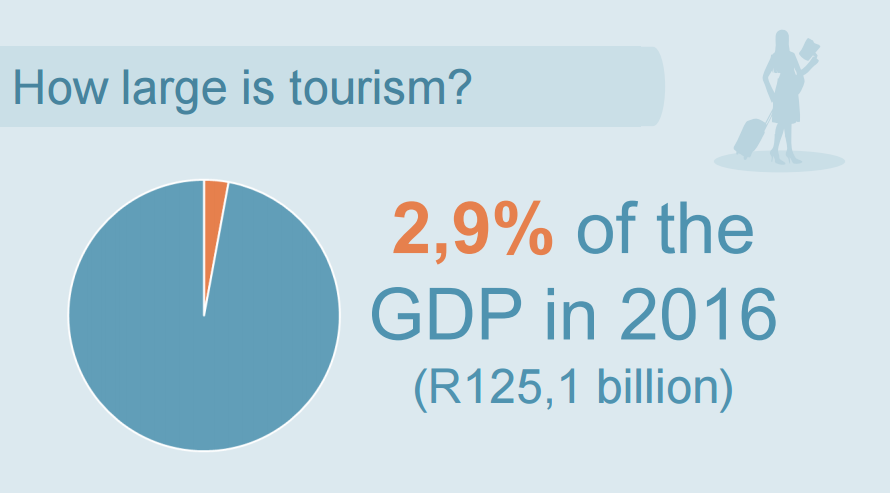
Nonetheless, numbers from Stats SA shows that Tourism contributed 2.9% to South Africa's economy. That is bigger than the whole agricultural sector in South Africa as the agricultural sector contributes roughly 2.5% to South Africa's economy.
Tourism is also mooted as a potential sector where large scale employment can be created for South Africans. So the question is just how many people are currently working in tourist related sectors and how much does that make up of South Africa's total employment levels?
|
|
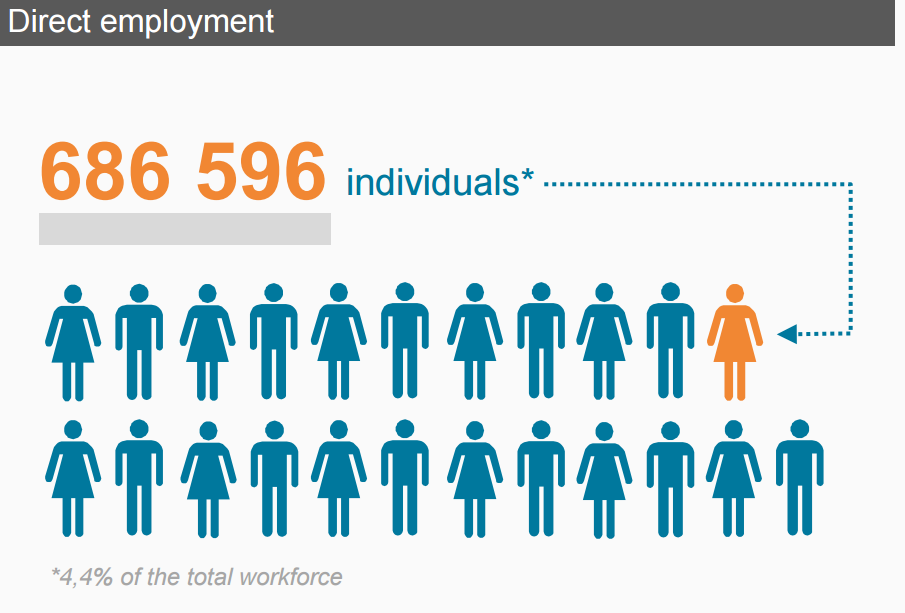
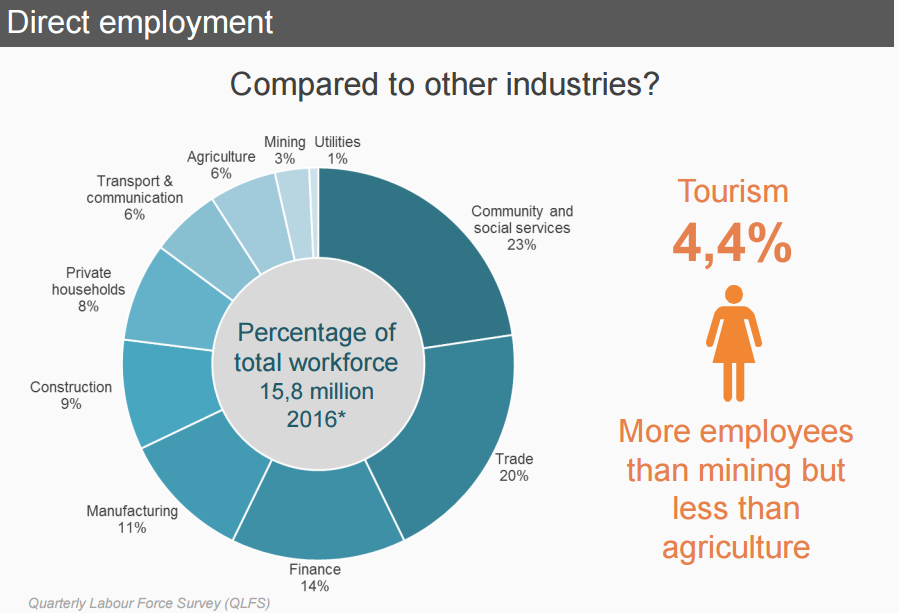
As the graphic above shows in 2016, 686 596 individuals were working in the tourist related sector, and this almost 687 000 individuals made up 4.4% of South Africa's total work force. So in which parts of the tourism industry does the 687 000 people work?
According to Stats SA the breakdown of the jobs in tourism are concentrated as follows:
According to Stats SA the breakdown of the jobs in tourism are concentrated as follows:
- Road Transport: 29%
- Food and beverages: 21%
- Accommodation: 19%
- Retail of tourism products: 16%
- Travel agencies: 4%
- Other: 10%
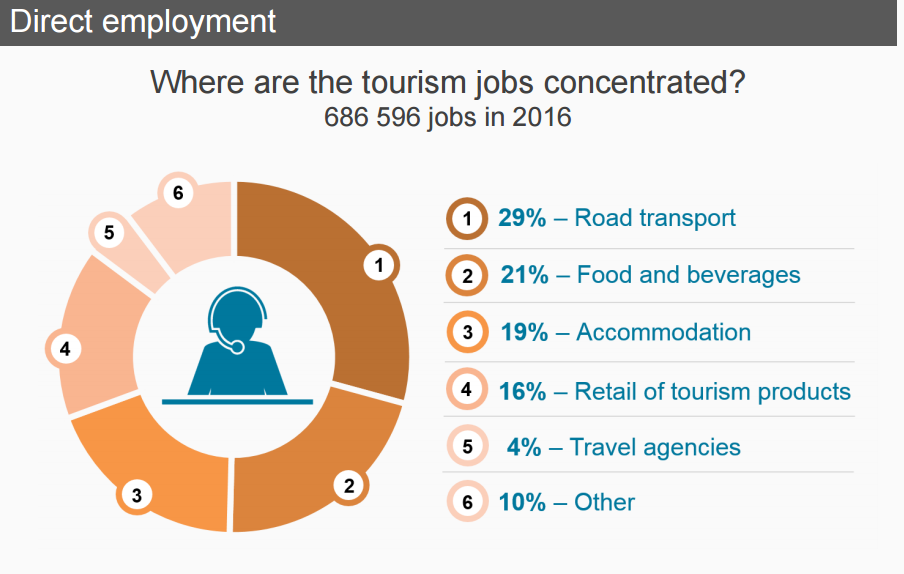
While the tourism industry in South Africa employs a lot of people, as it employs more people than the mining industry in South Africa. It still has a long way to go if it is to become a major employer and assist government in its attempts to reduce unemployment, by it becoming a bigger employer of people in future.
16 January 2018: Inbound tourist numbers (up to October 2017)
In today's update on Tourism statistics in South Africa we focus on the reasons for why European countries' tourists vist South Africa. Is it for business, holiday or to study? The first graphic shows the top 5 countries in terms of percentage of tourists from Europe who are in SA to study.
Based on the October 2017 tourism data, 4.3% of visitors from Bosnia-Herzegovnia are here to study. With just under 3% of visitors from Luxembourg coming to SA to study while just over 2.5% of Serbian visitors come to South Africa to study. The next graphic takes a look at the top 5 European countries visitors (in percentage terms) who are in South Africa for business.
The graphic below shows the top 5 European countries visitors (in percentage terms) who are in South Africa fro business (note this only reflects October 2017 data).
The last graphic will take a look at the top 5 European countries (in percentage terms) whose visitors are in South Africa on holiday.
All visitors in October 2017 coming from Andorra, Liechtenstein, Macedonia, Monaco and San Marino came to South Africa for a holiday. Not one of these countries visitors were here on business or for any from of studying/training.
For the month of October 2017, 176 969 visitors came to South Africa from Europe. And of that 4 841 were here on business (2.7%), 171 543 were here on holiday (96.9%) and 585 visitors from Europe in October 2017 came to South Africa for studies or training(0.33%).
Top10 European countries in terms of number of visitors coming to South Africa in October 2017:
Germany: 46290
UK: 38350
France: 25221
The Netherlands: 17211
Switzerland:7651
Belgium: 5755
Italy: 5659
Sweden: 4773
Spain: 4144
Denmark: 3232
These 10 countries make up 89% of all visitors from Europe in October 2017 coming to South Africa
27 November 2017: Inbound tourists into South Africa (Jan 2017 to Sep 2017)
The graphic below shows the number of tourists per month per region from January 2017 to September 2017. For reference and comparison purposes we added the same time periods of 2016 in the graphic. From this graph it is clear the majority of South Africa's inbound tourists come from other African countries.
A distant second place goes to Europe, with them contributing around 25% the amount of tourists into South Africa as the African continent. North America comes in a very distant 3rd place with about 6% of the amount of tourists that Africa contributes to South Africa's inbound tourism.
Overall inbound tourist contribution per region is as follows (as of September 2017)
The image below shows a zoomed in version of the graphic above focus on the August and September inbound tourism numbers.
Overall inbound tourist contribution per region is as follows (as of September 2017)
- Africa: 74.8%
- Europe: 13.8%
- North America: 4.6%
- Asia: 3.3%
- Australasia: 1.8%
- Central and South America: 1%
- Middle East: 0.5%
The image below shows a zoomed in version of the graphic above focus on the August and September inbound tourism numbers.
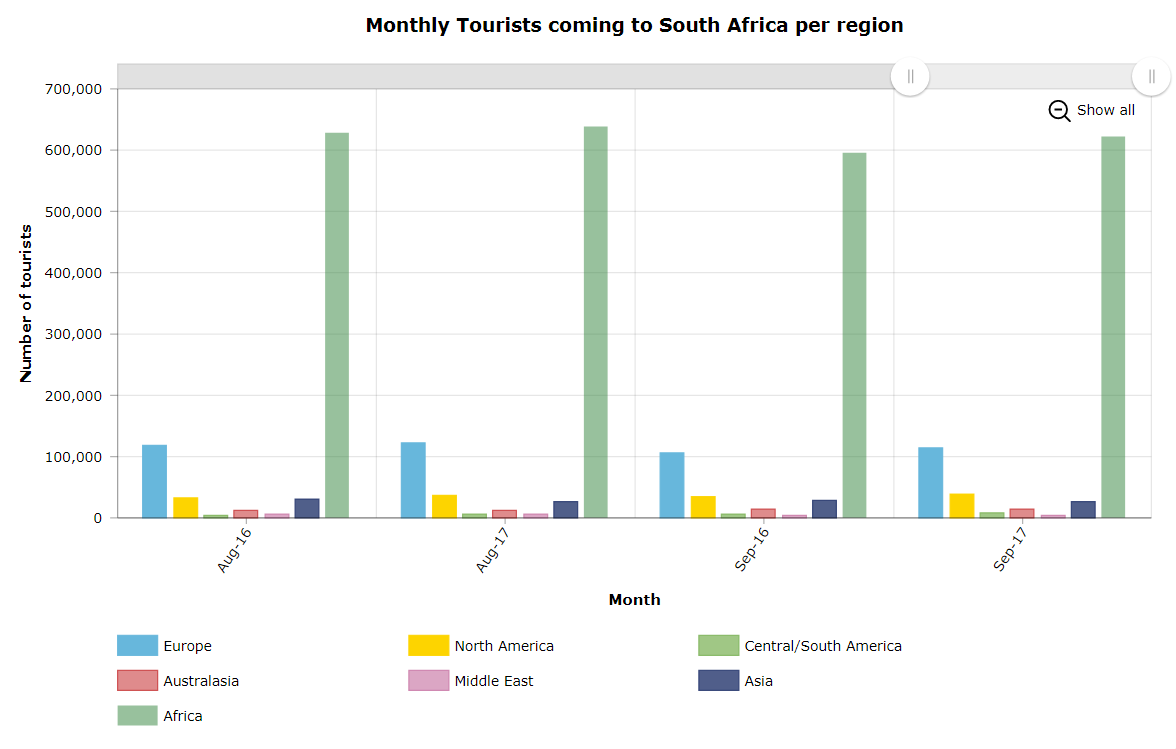
Inbound tourists into South Africa per region.
The graph below shows the top thirty countries contributing to inbound tourism in South Africa during September 2017. They are ranked in declining order. The top contributor to South Africa's inbound tourism is Zimbabwe with almost 156 000 people entering the country for "tourism", we suspect a whole lot of them become permanent tourist in South Africa with no plan of ever going back to Zimbabwe. For September 2017, Zimbabwean tourists made up 18.7% of all of South Africa's inbound tourists.
The top 10 countries contributing to South Africa's inbound tourism in September 2017:
Zimbabwe: 155 775
Lesotho: 136 638
Mozambique: 110 076
Swaziland: 77 241
Botswana: 70 926
USA: 32 551
UK: 28 904
Germany: 26 282
Namibia: 16 258
Malawi: 15 873
The top 10 countries contributing to South Africa's inbound tourism in September 2017:
Zimbabwe: 155 775
Lesotho: 136 638
Mozambique: 110 076
Swaziland: 77 241
Botswana: 70 926
USA: 32 551
UK: 28 904
Germany: 26 282
Namibia: 16 258
Malawi: 15 873
T
20 November 2017: Income earned per accommodation type per year
The following section will take a look at the amount of income generated from various accommodation types across South Africa per year. The income earned is in current prices (i.e inflation has not been removed from the numbers provided). The bar chart below shows the income per year per accommodation type (estimated for 2017 based on available data for 2017).
(The bar chart above shows that hotels earn the majority of income from accommodation across South Africa, with caravan parks and camp sites earning by far the least amount of income. Other accommodation types brings in the 2nd most amount of income from accommodation while guest houses and guest farms coming in a distant 3rd place. Worrying for the industry is the fact that growth in income earned from accommodation has not been significant, and this is with inflation included in the numbers reported. If inflation was stripped out of the numbers the growth reported will be even lower.
Not good for an industry government is pinning their hopes on to help revive South Africa's ailing economy. A weak Rand helps in making South Africa a cheap holiday destinations for foreigners (particularly those from Europe and North America. Sadly increased crime and targeting of tourists arriving in South Africa is scaring off potential tourists that considered South Africa as a holiday destination.
Predicted income from the various accommodation types for 2017 is estimated to be as follows:
Hotels: R14.7billion
Caravan Parks and Camping sites: R175.4million
Guest houses and Guest farms: R1.9billion
Other Accommodation: R6.3billion
Below the same graphic as above but with inflation stripped out of the income earned. And the difference in the graphics is substantial (look at the value of the left hand axis).
From the above it is clear that if inflation is stripped out of the numbers, hotels are actually earning less income (in real terms) now than they did in 2007. In fact their predicted earnings in 2017 is expected to be -5.3% lower than the real earnings in 2007. So what is the difference in the growth in income earned per accommodation type before has been removed and after inflation has been removed? The table below provides that answer.
The table below shows the growth in income earned from various accommodation types from 2007 to 2017 (both before inflation has been removed as well as after inflation has been removed from the numbers). And as the table shows the growth rates are substantially lower once inflation has been stripped out of the numbers. It also highlights the plight of hotels in that compared to 2007 prices their income earned has actually been declining. While guest houses and guest farms and "other" accommodation has shown significant growth in income earned even after inflation has been removed from the numbers. Clearly those wanting to invest in the sector should look for guest houses and guest farms or other types of accommodation rather than investing in hotels or caravan parks and camping sites as growth in earnings is substantially higher in those accommodation types
Description |
Hotels |
Caravan Parks & camping sites |
Guest houses and guest farms |
Other |
Growth before inflation |
53.2% |
74.4% |
133.5% |
218.9% |
Growth after inflation |
-5.3% |
7.8% |
44.3% |
97.1% |
April 2016: Inbound Tourism Statistics
This interactive maps provides more details on South Africa's Tourism sector. The map shows which countries' people visiting South Africa is from. (Note only selected large countries in terms of tourism numbers are highlighted in this graph). Scroll over each country's target icons to get the value for December 2015 and December 2014. If you hover over South Africa you will see the total number of tourists entering our country for both December 2014 and December 2015. Note Map below based on March 2016 data.
From the above map it's clear when scrolling over the target icon's that the number of tourists from most of the selected countries have increased significantly from 12 months ago. In total foreign arrivals in South Africa came to 1 320 375 people in April 2016 compared to 1 169 290 in April 2015, an increase of 12,92% , from a year ago.
Overseas visitors increased by roughly 44 000 up from 144 771 in March 2015 to 188 491 in March 2016 (an increase of 30.1% from a year ago). Seems the weak Rand is luring foreign visitors to South Africa. At least one small positive coming from our ever weaker exchange rate.
Overseas visitors increased by roughly 44 000 up from 144 771 in March 2015 to 188 491 in March 2016 (an increase of 30.1% from a year ago). Seems the weak Rand is luring foreign visitors to South Africa. At least one small positive coming from our ever weaker exchange rate.
South African VISA regulation changes:
So what impact did the VISA regulation changes have on South Africa's inbound tourism industry? We take a look at some of our biggest inbound tourist destinations (excluding African countries) and their monthly tourist visitor numbers before and after the legislation was introduced.
The graphic below shows 9 of our major inbound tourism destinations (we tried including a country or two from each continent). The UK is a large contributor to overseas visitors visiting South Africa. And for December 2015 there was a spike in the number of visitors from the UK. We can assume the weak Rand exchange rate vs the British Pound contributed to that spike (as it becomes cheaper for visitors from the UK to visit South Africa. In addition to this the England cricket team touring South Africa surely contributed to this spike in inbound tourists too, as the "BARMY ARMY" flooded into South Africa to support their cricket team.
Source of Data: Statistics South Africa, Tourism and Migration
Seems that while there is debate about whether the South African government has in fact revised VISA requirements with regards to unabridged birth certificates. But the numbers above sure tells a story.
Based on the latest results from the Tourist and Migration survey foreign travelers arriving in South Africa increased from 1 169 290 in April 2015 to 1 320 375 in April 2016 (an increase of 151 085 inbound tourists) , departures by foreigners increased by 10,2% (from 1 124 179 in April 2015 to 1 238 684 in April 2016), and transits increased by 15,6% (from 55 046 in April 2015 to 63 609 in April 2016). These numbers should make hotel groups such as City Lodge Hotels very happy.
Based on the latest results from the Tourist and Migration survey foreign travelers arriving in South Africa increased from 1 169 290 in April 2015 to 1 320 375 in April 2016 (an increase of 151 085 inbound tourists) , departures by foreigners increased by 10,2% (from 1 124 179 in April 2015 to 1 238 684 in April 2016), and transits increased by 15,6% (from 55 046 in April 2015 to 63 609 in April 2016). These numbers should make hotel groups such as City Lodge Hotels very happy.