|
Related Topics |
|
This page's sole purpose is to provide readers with interactive charts and graphics regarding South Africa's unemployment rate. The page will be updated periodically as more information regarding South Africa's unemployment rate becomes available.
|
|
29 September 2020: SA unemployment rate declines sharply during Covid-19
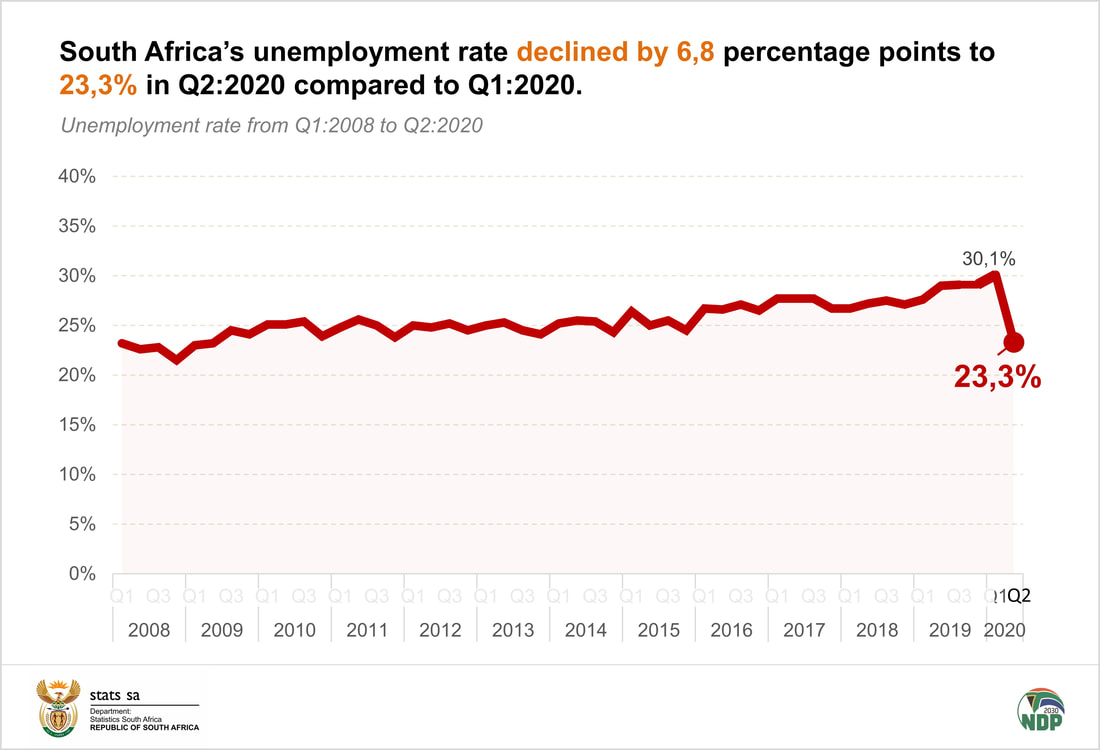
tatistics South Africa today reported that South Africa's unemployment rate declined substantially from 30.1% in 1st quarter of 2020 to 23.3% in the second quarter of 2020 (the quarter Covid-19 saw SA go into Level 5 lockdown). So how come the unemployment rate improved by so much during the most difficult economic times in our country's history? As GDP showed the economy shrunk by 51% when comparing the 2nd quarter of 2020 to the first quarter of 2020. So the economy shrunk by 51% yet unemployment improved substantially.
So 1st quarter of 2020: 30.1% unemployment
2nd quarter of 2020: 23.3% unemployment
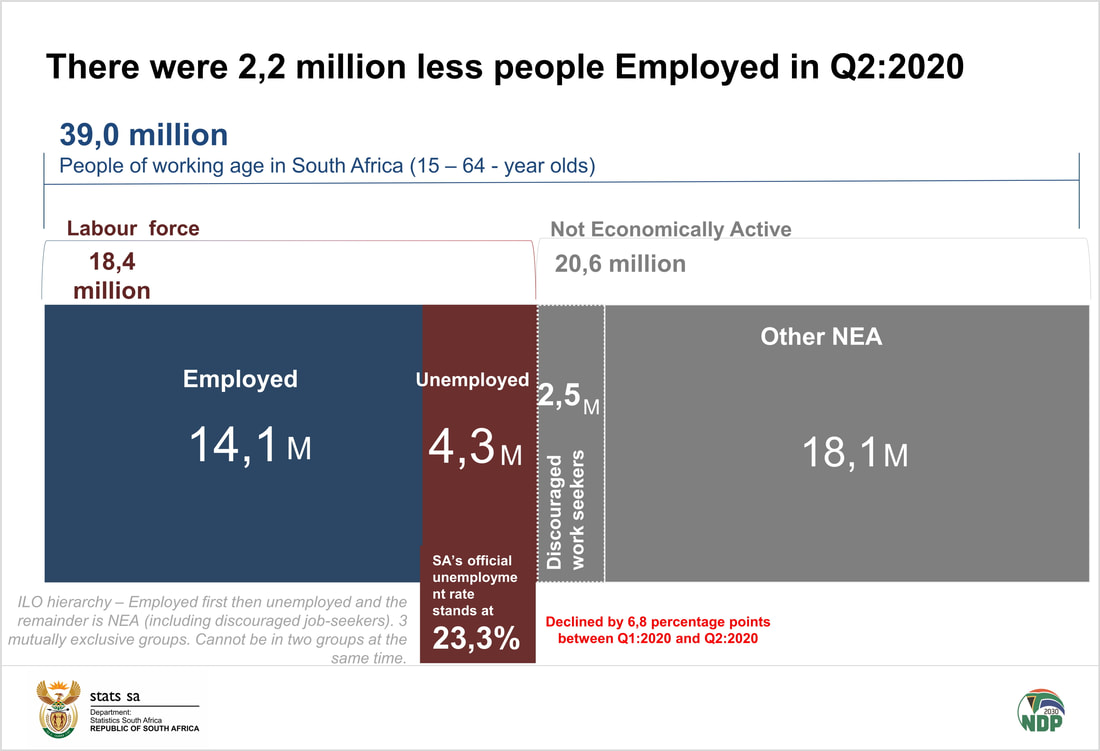
In addition to this Statistics South Africa actually reported that 2.2 million people lost their job during the 2nd quarter of 2020. So how come the unemployment rate improved when the economy shrunk and the economy shed 2.2 million jobs. Well this is due to a technicality in the official and expanded definition of employment.
Those who have given up looking for work, is no longer seen or counted as unemployed (they are either deemed as discouraged work seekers or part of other not economically active). And this number increased substantially for the 2nd quarter of 2020 (by 2.8 million in fact). So number of unemployed people decreased by 2.8 million to 4.3 million down from 7.1 million. In total there are 18.1 million people between the age of 16-65 that are not economically active (employed). This of course includes teenagers that are in school and studying, but the large bulk of this remains adults that are not employed as they have given up looking, or chose to be not employed at this point.
So 1st quarter of 2020: 30.1% unemployment
2nd quarter of 2020: 23.3% unemployment
In addition to this Statistics South Africa actually reported that 2.2 million people lost their job during the 2nd quarter of 2020. So how come the unemployment rate improved when the economy shrunk and the economy shed 2.2 million jobs. Well this is due to a technicality in the official and expanded definition of employment.
Those who have given up looking for work, is no longer seen or counted as unemployed (they are either deemed as discouraged work seekers or part of other not economically active). And this number increased substantially for the 2nd quarter of 2020 (by 2.8 million in fact). So number of unemployed people decreased by 2.8 million to 4.3 million down from 7.1 million. In total there are 18.1 million people between the age of 16-65 that are not economically active (employed). This of course includes teenagers that are in school and studying, but the large bulk of this remains adults that are not employed as they have given up looking, or chose to be not employed at this point.
|
|
For us the unemployment number is a farce as it stands right now. The expanded definition of unemployment provides a truer reflection of the employment and economic environment of South Africa. With this sitting at 42%. So actually 42% of people who are looking for work is currently unemployed.
17 February 2020: Number of employed men and women per occupation type
We take a look at the latest employment data published by Statistics South Africa in their quarterly labour force survey (QLFS) and focus on the positions occupied by men and women who are employed in South Africa
Women
Men
In total there were 9.201 million men employed during the 4th quarter of 2019 while there were 7.220 million women employed during the said period. 23.5% of men were employed in elementary jobs, with 22.16% of women employed in elementary jobs. Almost a million women (954 000) were employed as domestic workers (13.2% of the women employed in South Africa), while only 59 000 men were employed as domestic workers (including gardeners etc.), which makes up 0.64% of all men employed in South Africa
Women
- Manager: 447 000 (6.19%)
- Professional: 514 000 (7.12%)
- Technician: 742 000 (10.27%)
- Clerk: 1 256 000 (17.39%)
- Sales and services: 1 287 000 (17.83%)
- Skilled agriculture: 23 000 ( 0.31%)
- Craft and related trade: 230 000 (3.19%)
- Plant and machine operator: 167 000 ( 2.31%)
- Elementary: 1 600 000 (22.16%)
- Domestic worker: 954 000 (13.21%)
- Other: 2 000 (0.02%)
- Total: 7 220 000 (100.00%)
Men
- Manager: 993 000 (10.80%)
- Professional: 456 000 (4.96%)
- Technician: 659 000 (7.17%)
- Clerk: 477 000 (5.19%)
- Sales and services: 1 451 000 (15.77%)
- Skilled agriculture: 56 000 (0.61%)
- Craft and related trade: 1 677 000 ( 18.23%)
- Plant and machine operator: 1 208 000 (13.13%)
- Elementary: 2 162 000 (23.50%)
- Domestic worker: 59 000 (0.64%)
- Other: 1 000 (0.01%)
- Total: 9 201 000 (100.00%)
In total there were 9.201 million men employed during the 4th quarter of 2019 while there were 7.220 million women employed during the said period. 23.5% of men were employed in elementary jobs, with 22.16% of women employed in elementary jobs. Almost a million women (954 000) were employed as domestic workers (13.2% of the women employed in South Africa), while only 59 000 men were employed as domestic workers (including gardeners etc.), which makes up 0.64% of all men employed in South Africa
13 February 2020: Number of employed and unemployed per province
In this update we take a look at the number of people employed and unemployed per province in South Africa for the 4th quarter of 2019. The summary below shows the number employed and unemployed people per province in South Africa for the 4th quarter of 2019 sorted from most number of employees to least number of employees
Employed Unemployed
For more detail read here
Employed Unemployed
- Gauteng: 5 098 000 2 271 000
- KwaZulu-Natal: 2 664 000 890 000
- Western Cape: 2 518 000 665 000
- Limpopo: 1 400 000 421 000
- Eastern Cape: 1 384 000 904 000
- Mpumalanga: 1 244 000 629 000
- North West: 992 000 401 000
- Free State: 785 000 423 000
- Northern Cape: 335 000 123 000
For more detail read here
11 February 2020: South Africa's Q4: 2019 unemployment rate at 29.1%
Statistics South Africa released the latest results of its Quarterly Labour Force Survey (QLFS) which is used as the official gauge to measure South Africa's unemployment rate. The summary below is as released by Statistics South Africa
Start statement from Statistics South Africa
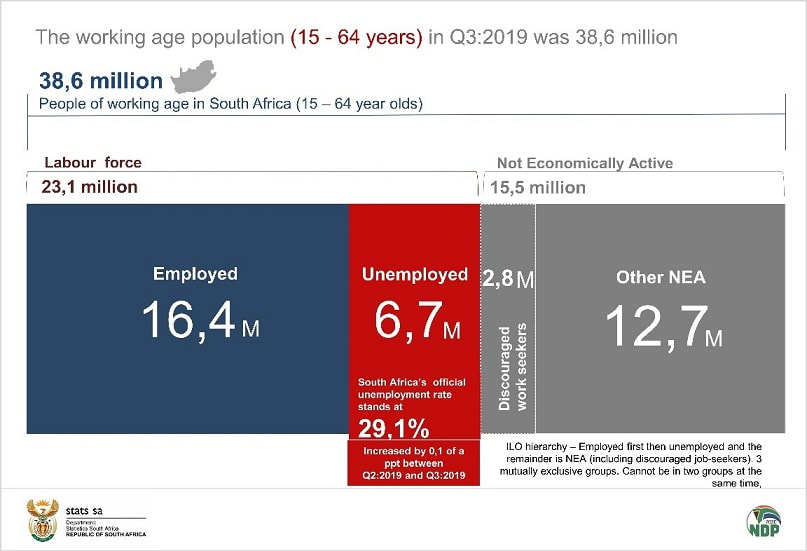
The results of the Quarterly Labour Force Survey (QLFS) for the fourth quarter of 2019 indicate that the official unemployment rate remained unchanged (29,1%) compared to the third quarter of 2019. The results further indicate that the number of employed persons increased by 45 000 to 16,4 million and the number of unemployed persons decreased by 8 000 to 6,7 million in Q4: 2019 compared to Q3: 2019, resulting in an increase of 38 000 in the labour force.
The South African working-age population increased by 145 000 in Q4:2019 compared to Q3:2019. The number of discouraged work-seekers increased by 62 000 and those who were not active in the labour market for other reasons other than discouragement increased by 45 000 resulting in a net increase of 107 000 in the number of those who were not economically active. Employment increased in two of the four sectors in Q4: 2019.
The formal sector recording the largest employment increase of 117 000 followed by Agriculture (6 000). Employment in the informal sector declined by 77 000 and remain unchanged in the Private households. An increase of 45 000 in the number of people in employment in the fourth quarter of 2019 was mainly driven by Community and social services with 113 000, followed by Finance (76 000) and Transport with 36 000. Declines in employment were recorded in Trade (159 000), Manufacturing (39 000) and Utilities (14 000).
There were approximately 10,3 million persons aged 15–24 years in Q4:2019. The share of these young people who were not in employment, education or training (NEET) decreased by 0,4 of a percentage point from 32,3% in Q3:2019 to 32,0% (3,3 million) in Q4:2019. Of the 20,4 million young people aged 15-34 years, 40,1% were not in employment, education or training (NEET) in Q4:2019 – a decrease of 0,3 of a percentage point compared to Q3:2019.
End statement from Statistics South Africa.
As at the end of December 2019 the unemployment rate for men and women in South Africa were as follows
As at the end of December 2019 the number of employed men and women in South Africa were as follows
Start statement from Statistics South Africa
The results of the Quarterly Labour Force Survey (QLFS) for the fourth quarter of 2019 indicate that the official unemployment rate remained unchanged (29,1%) compared to the third quarter of 2019. The results further indicate that the number of employed persons increased by 45 000 to 16,4 million and the number of unemployed persons decreased by 8 000 to 6,7 million in Q4: 2019 compared to Q3: 2019, resulting in an increase of 38 000 in the labour force.
The South African working-age population increased by 145 000 in Q4:2019 compared to Q3:2019. The number of discouraged work-seekers increased by 62 000 and those who were not active in the labour market for other reasons other than discouragement increased by 45 000 resulting in a net increase of 107 000 in the number of those who were not economically active. Employment increased in two of the four sectors in Q4: 2019.
The formal sector recording the largest employment increase of 117 000 followed by Agriculture (6 000). Employment in the informal sector declined by 77 000 and remain unchanged in the Private households. An increase of 45 000 in the number of people in employment in the fourth quarter of 2019 was mainly driven by Community and social services with 113 000, followed by Finance (76 000) and Transport with 36 000. Declines in employment were recorded in Trade (159 000), Manufacturing (39 000) and Utilities (14 000).
There were approximately 10,3 million persons aged 15–24 years in Q4:2019. The share of these young people who were not in employment, education or training (NEET) decreased by 0,4 of a percentage point from 32,3% in Q3:2019 to 32,0% (3,3 million) in Q4:2019. Of the 20,4 million young people aged 15-34 years, 40,1% were not in employment, education or training (NEET) in Q4:2019 – a decrease of 0,3 of a percentage point compared to Q3:2019.
End statement from Statistics South Africa.
As at the end of December 2019 the unemployment rate for men and women in South Africa were as follows
- Men: 27.2%
- Women: 31.3%
As at the end of December 2019 the number of employed men and women in South Africa were as follows
- Men: 9.201 million
- Women: 7.220 milion
17 December 2019: Continued job losses in the formal sector
According to the latest Quarterly Employment Statistics (QES) published by Statistics South Africa the formal sector shed 28 000 jobs during the third quarter of 2019 (July-September 2019). Not good news for 28 000 families so close to the December holidays. And add to this the fact that South Africa's economy contracted by -0.6% during the 3rd quarter of 2019, the prospects of getting re-employed in an economy that is not growing is slim, especially considering the job seekers keeps increasing as more and more students that is finishing their schooling and studies are looking to enter the job market. Below a short extract as obtained from Statistics South Africa, discussing the latest QES results.
Formal sector employment decreased by 28 000 in September 2019, with 11 000 full-time and 17 000 part-time jobs shed during the quarter.
The September 2019 Quarterly Employment Statistics (QES) survey showed that an estimated 10 142 000 people were employed in the formal non-agricultural sector of the South African economy, which is down by 28 000 from 10 170 000 in the previous quarter.
The quarterly decrease in total employment was driven by job losses in construction (-12 000); manufacturing (-12 000); community services (-11 000); business services (-9 000); and transport (-1 000). The electricity and mining industries were unchanged in September.
The only industry to record a quarterly increase was trade, up by 17 000 jobs.
Total employment increased by 78 000 between September 2018 and September 2019, with 45 000 full-time and 33 000 part-time jobs added. This increase was largely due to job increases in community services (54 000); trade (53 000); business services (28 000); and mining (6 000). Annual job losses were reported by construction (-37 000); manufacturing (-22 000); electricity (-3 000); and transport (-1 000). Total earnings paid to employees amounted to R711,2 billion in September 2019, up from R699,5 billion in June 2019, a quarterly increase of 1,7%.
5 November 2019: SA's unemployment rate continues to rise
South Africa's single biggest economic problem remains the extremely high and increasing unemployment rate which is sitting at levels above 29% right now. The extract below was obtained from Statistics South Africa
South Africa’s unemployment rate increased by 0,1 of a percentage point to 29,1% in Q3 of 2019. According to the Quarterly Labour Force Survey (QLFS) released by Statistics South Africa, this is the highest unemployment rate since Stats SA started measuring unemployment using the QLFS in 2008.
South Africa’s unemployment rate increased by 0,1 of a percentage point to 29,1% in Q3 of 2019. According to the Quarterly Labour Force Survey (QLFS) released by Statistics South Africa, this is the highest unemployment rate since Stats SA started measuring unemployment using the QLFS in 2008.
Between Q2: 2019 and Q3: 2019, the number of employed persons increased in four of the ten industries, with the largest increase recorded in the Community and social services industry (56 000), followed by Agriculture and Mining with 38 000 each and Private households (35 000). Declines in employment were recorded in the Manufacturing (30 000), Construction (24 000), Trade (21 000) and Utilities (18 000) industries.
Compared to the same period last year, a net decline of 5 000 in total employment was largely due to decreases in the number of people employed in Construction (163 000), Utilities (23 000) and Transport (21 000) in Q3: 2019 and employment gains in Trade (103 000) and Manufacturing (41 000) during the same period.
Employment increased in five of the ten occupations in Q3: 2019 compared to the previous quarter. The largest increase was observed in Professional occupations (up by 122 000), followed by those in Sales and services (up by 89 000) and Elementary (up by 38 000) occupations. Manager occupations (92 000) recorded the largest employment losses, followed by Craft and related trade (45 000), Plant and machine operator (43 000) and Technician (41 000) occupations, while Clerical occupations recorded the lowest decrease of 12 000 jobs.
The largest employment increase was observed in the formal sector (43 000), followed by the Agriculture and Private household sectors with 38 000 and 35 000, respectively. Employment in the informal sector, on the other hand, declined by 53 000 in Q3: 2019 compared to Q2: 2019.
According to the survey, the number of discouraged work-seekers increased by 44 000 while the number of people who were not economically active for reasons other than discouragement decreased by 35 000 between the second and the third quarters of 2019, resulting in a net increase of 9 000 in the not economically active population.
Compared to a year ago, total employment decreased by 5 000, the number of unemployed persons increased by 8,4% (524 000), and the number of persons who were not economically active increased by 0,5% (78 000).
The number of employed persons increased by 62 000 to 16,4 million in Q3: 2019, with the number of unemployed persons also showing an increase of 78 000 to 6,7 million compared to Q2: 2019, resulting in an increase of 141 000 (up by 0,6%) in the number of people in the labour force. The working-age population (15–64 years) in Q3: 2019 was 38,6 million.
Year-on-year changes show that losses in employment were mainly driven by Craft and related trade occupations (106 000), followed by Elementary (55 000), Plant and machine operator (39 000) and Technician (4 000) occupations. Sales and services (124 000), Domestic worker (43 000), Professional (13 000), Clerk and Skilled agriculture (7 000 each) and Manager (5 000) occupations recorded gains in employment in Q3: 2019 compared to Q3: 2018.
31 July 2019: Unemployment rate in South Africa reads an all time high
In what is compounding South Africa's social and economic problems, South Africa's unemployment rate is now at an all time high. Add to this declining taxes collected, increased government spending plans, increased state guarantees for state owned enterprises the latest unemployment numbers will add to South Africa's economic woes. The summary below shows the unemployment rate for South Africa and all its provinces for the 2nd quarter of 2019.
And one should note this is the stricter definition of employment where those who has given up looking for a job are excluded from the calculation of the unemployment rate. So the actual expanded unemployment rate is even greater than the numbers above. Looking at the strict definition unemployment rate numbers basically one in three South Africans are unemployed. So to those that are employed. Be grateful for the fact that you do have a job.
- Eastern Cape: 35.4%
- Mpumalanga: 34.7%
- Free State: 34.4%
- North West: 33.0%
- Gauteng: 31.1%
- Northern Cape: 29.4%
- South Africa: 29.0%
- KwaZulu Natal: 26.1%
- Western Cape: 20.4%
- Limpopo: 20.3%
And one should note this is the stricter definition of employment where those who has given up looking for a job are excluded from the calculation of the unemployment rate. So the actual expanded unemployment rate is even greater than the numbers above. Looking at the strict definition unemployment rate numbers basically one in three South Africans are unemployed. So to those that are employed. Be grateful for the fact that you do have a job.
Advertisement
10 June 2019: Employment per industry vs size of industry
On this page we tend to focus on the unemployment rate and those who are unemployed. In today's update we take a look at the share of various industries in South Africa's total economy and compare it to the employment share of these industries. The image below shows there size of each industry in percentage terms as well as the percentage of total employees in South Africa for each of these industries
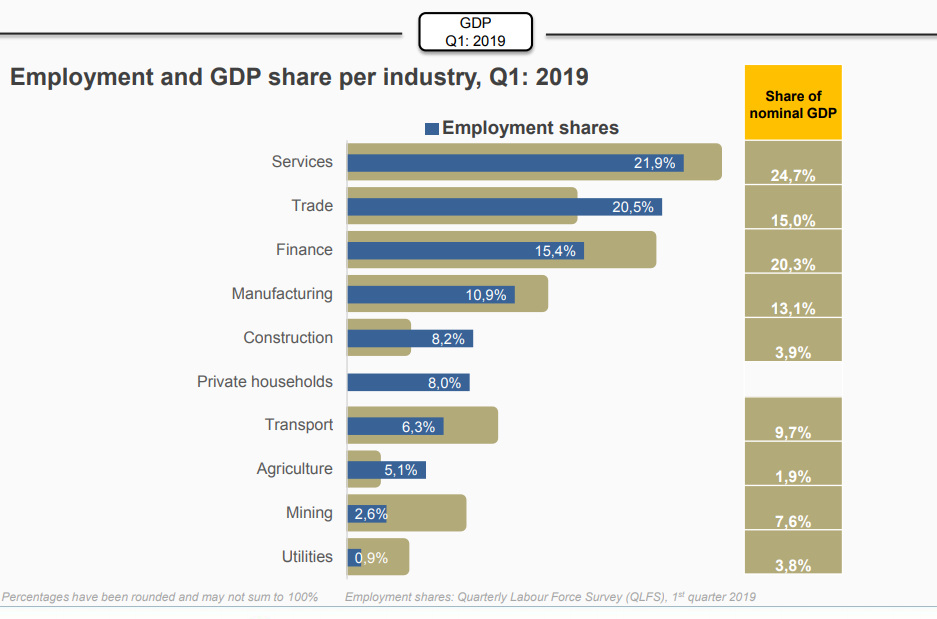
So what the image above shows is that while Trade (wholesale, retail and motor trade) makes up 15% of South Africa's economy, it employs 20.5% of all those employed in South Africa. So it is a labour intensive industry. Agriculture only makes up 1.9% of South Africa's economy yet it employs 5.1% of the people that are employed in South Africa. Finance makes up 20.3% of South Africa's economy but it only employs 15.4% of the people employed in South Africa.
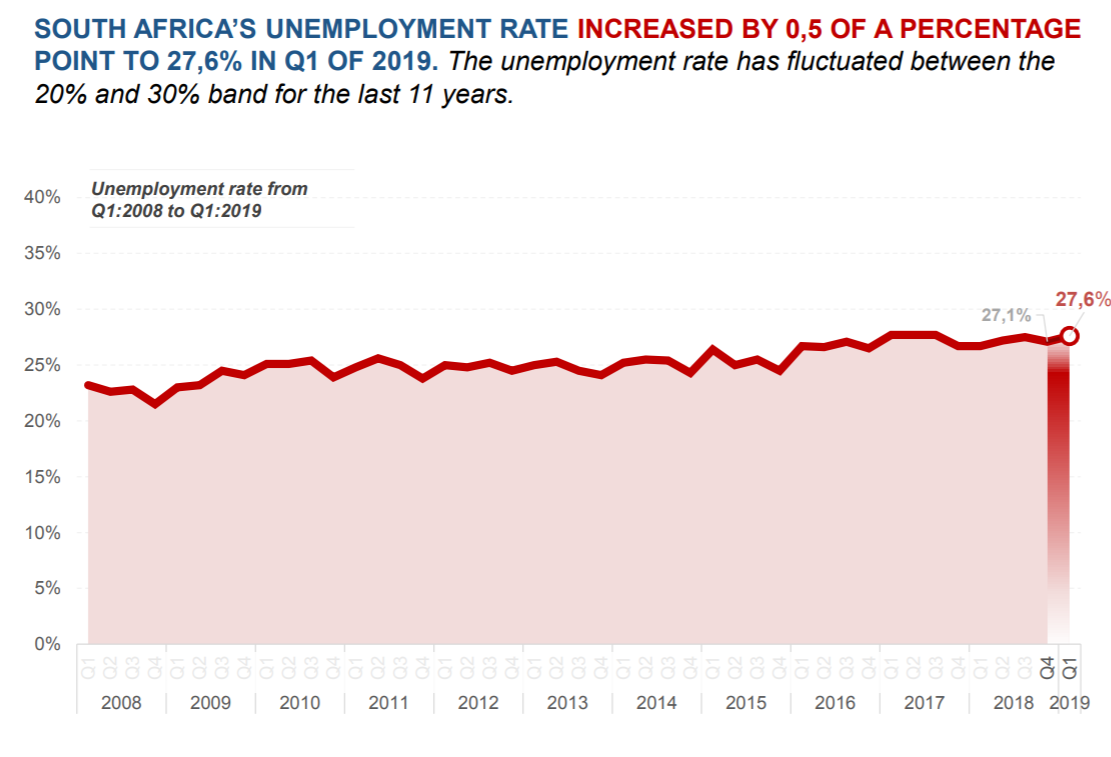
14 May 2019: Q1:2019 unemployment rate at 27.6%
In the latest Quarterly Labour Force Survey (QLFS) published by Statistics South Africa for the first quarter of 2019 it is reported that the official unemployment rate as at Q1:2019 was sitting at 27.6%, a deterioration from the 27.1% reported in the 4th quarter of 2018. The image below as obtained from Stats SA shows the unemployment rate of South Africa over time.
Even more concerning for South Africans is the amount of people classified as NEET. NEET is an acronym for not in employment education or training and covers youths between the ages of 15-24. As we discussed at length in our Education Statistics Page, this is one of the single biggest problems facing South Africa. The image below shows the percentage male and female youths (between the ages of 15-24) that are seen as part of NEET.
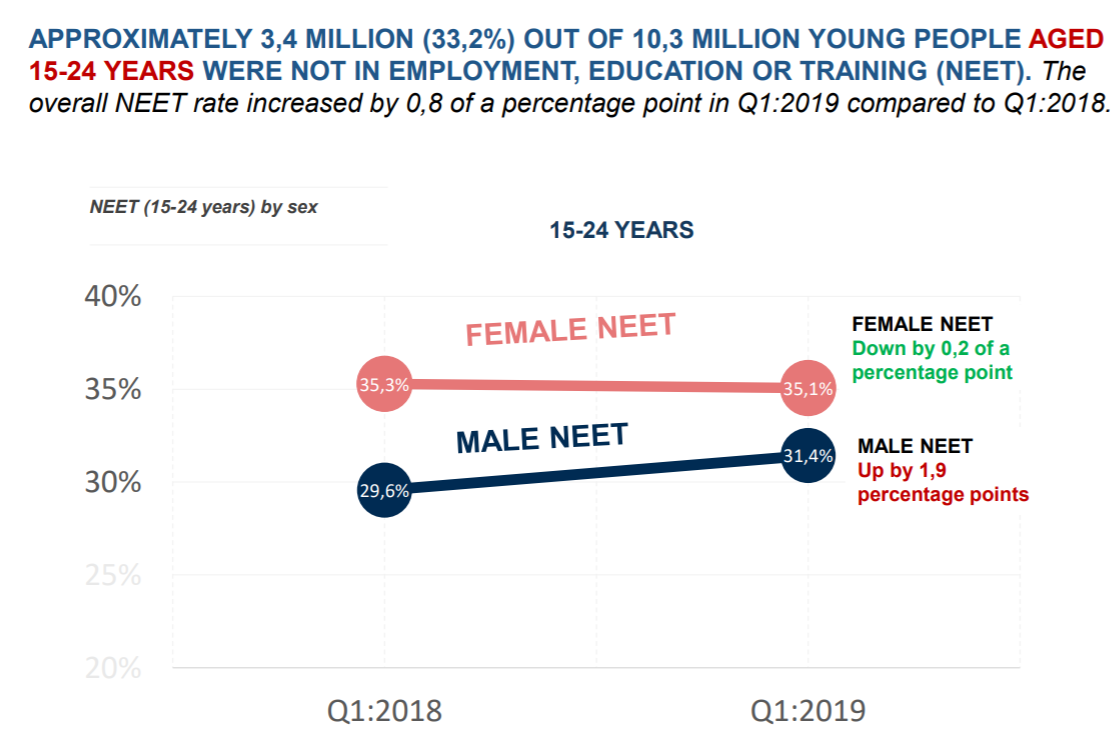
In total 3.4million youths between the ages of 15-24 is classified as NEET (or not in employment, education or training). So 33.2% of the 10.3 million young people are part of NEET. It is according to us one of the single biggest issues plaguing South Africa and its economy right now. This has to be a serious concern for government. The fact that so many of the young people in South Africa is not in education and is not employed either. We say again, youth unemployment is one of the single biggest issues in the South African economy right now. So lets take a look at the percentage of youths classified as NEET per province.
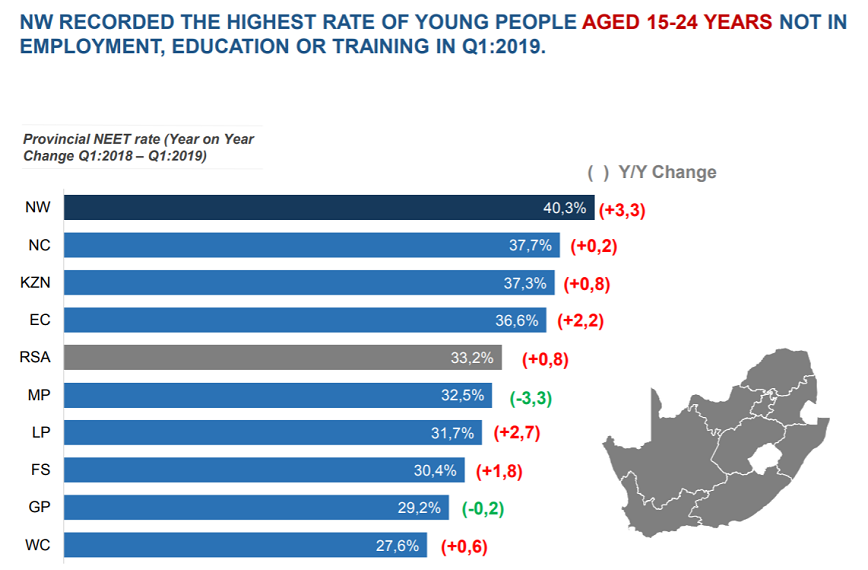
North West had the highest percentage of youths not in employment, education or training with their NEET sitting at 40.3% and the Western Cape registered the lowest percentage of youths not in employment, education or training, with the province's NEET sitting at 27.6%
12 February 2019: Q4:2018 unemployment rate came in at 27.1%
The bar chart below shows the latest unemployment rates per province and for South Africa as a whole, as well as showing the unemployment rates per province as measured in the 3rd quarter of 2018.
So Limpopo has the lowest unemployment rate, closely followed by the Western Cape. At the other end of the spectrum the Eastern Cape had the highest levels of unemployment during Q4:2018 closely followed by the Free State. The summary below shows the inflation rate per province, from lowest to highest as recorded during Q4:2018.
- Limpopo: 16.5%
- Western Cape: 19.3%
- Northern Cape: 25%
- North West: 26.6%
- South Africa: 27.1%
- KwaZulu-Natal: 28.5%
- Gauteng: 29%
- Mpumalanga: 32%
- Free State: 32.9%
- Eastern Cape: 36.1%
31 October 2018: Long vs short term unemployment
In this update we take a look at a short note released by Statistics South Africa regarding long vs short term unemployment in South Africa. The note published by Statistics South Africa below.
"South Africa’s official unemployment rate is on the increase. In the past 10 years (2008–2018), the unemployment rate has increased from 21,5% to almost 28,0%. Unemployment refers to those persons who were not employed, had taken steps to look for a job or to start a business and were available to take up a job had it been offered. Now, the main hiccup lies with those persons who have been unemployed for longer periods and still do not find any form of employment.
Long-term unemployment refers to people who have been unemployed for 12 months or more. The long-term unemployment rate shows the proportion of persons in long-term unemployment among all unemployed persons. According to the Quarterly Labour Force Survey, Q3: 2018, released by Statistics South Africa, 6,2 million South Africans are now unemployed, and 4,3 million of them have been unemployed for a year or longer. Between Q3: 2008 and Q3: 2018, the number of persons who were in long-term unemployment increased by 1,7 million, from 2,6 million in 2008.
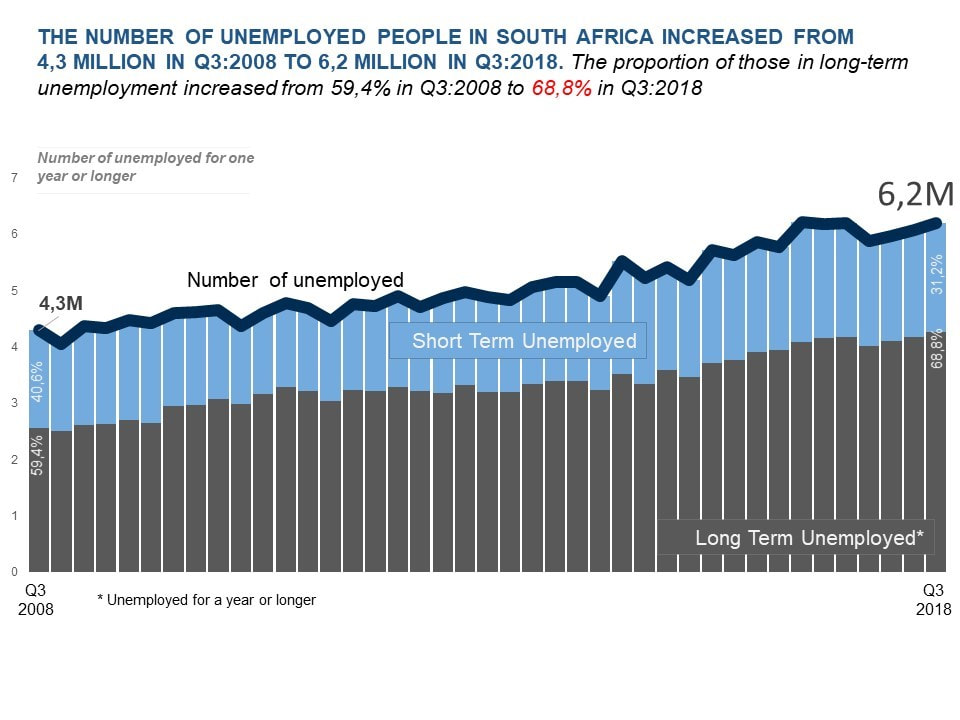
This has resulted in the proportion of persons in long-term unemployment increasing by 9,4 percentage points from 59,4% in Q3: 2008 to 68,8% in Q3: 2018.
The most affected persons were women and youth. More men (51,4%) than women were unemployed in 2018 compared to 2008. However, the percentage of women who were in long-term unemployment was higher than that of men in both 2008 and 2018. Long-term unemployment affects the youth more than it affects the adults. Although the percentage of youth in long-term unemployment declined by 7,4 percentage points from 2008 to 2018, about two-thirds of those in long-term unemployment were youth (15–34 years) in 2018.
According to the OECD, long-term unemployment causes significant mental and material stress for those affected and their families. It is also of particular concern for policymakers, as high rates of long-term unemployment indicate that labour markets are operating inefficiently.¹
Once a person has been in long-term unemployment, the probability of finding a job declines, leaving them at risk of being permanently detached from the labour market."
The original note can be found here: StatsSA-unemployment-note
End of note
30 October 2018: South Africa's unemployment for Q3:2018 remains stubbornly high
Statistics South Africa reported that South Africa's unemployment rate for the 3rd quarter of 2018 came in at 27.5% which is close to the all time record high unemployment rate of South Africa. Not good news for those writing matric exams or those looking to finish their studies at the end of this year. The "Jobs summit" might need to be reconvened as this number will not please the governing party and with even state owned entities such as the SABC talking about retrenchments, how can government expect the business sector to keep employing new people during tough and sluggish economic times? The line chart below shows the official unemployment rate per quarter since the beginning of 2008. And the graphic shows, the trend over the last number of years have gone up steadily. Not inspiring any form of confidence in South Africa or its economy and its ability to address unemployment and poverty.
No amount of talking and debating at a jobs summit will solve this problem. The only thing that will lift people out of unemployment and poverty is economic growth and job creation. And in order to do that the right policies, political programs and efficient government and efficient government spending needs to be in place to foster and maintain a environment in which businesses and individuals can flourish in. If the government is really serious about creating jobs and growing the economy, and not just looting state resources, the time to let go of policies such as land expropriation without compensation is now. In addition to this lower corporate taxes would free up money for companies to keep staff employed or to expand and employ additional staff, who will then be taxed and help to widen South Africa's tax base. If steps like these are not taken urgently, we see South Africa's unemployment rate reaching new record highs very very soon.
15 May 2018: The number of employed vs unemployed in South Africa (up to Q1:2018)
The bar chart below takes a look at the employed vs unemployed in South Africa for the last 5 quarters. (Quarter 1 2017 to Quarter 1 2018). Note the employment and unemployment rates are on two different axis. But the pattern is clear, both the employment numbers and unemployment numbers remains fairly stable, In an ideal world, South Africa would like the bars for the employed to increase and the bar for the unemployed to decrease.
The official unemployment rate in South Africa for the first quarter of 2018 came in at 26.7% , which is the same as the unemployment rate for the last quarter of 2017.
The official unemployment rate in South Africa for the first quarter of 2018 came in at 26.7% , which is the same as the unemployment rate for the last quarter of 2017.
According to the latest numbers published by Statistics South Africa there are 16.37million people employed (in both the formal and informal sector of South Africa) while there are 5.98million people that are unemployed in South Africa.
South Africa also has 15.3million people that are not economically active (that is they are of legal working age but not working at all). Of the 15.3million that are not economically active, 2.78million people are discouraged work seekers. Discouraged work seekers are those that want to work but cannot find work, but are looking. The rest of the 15.3million not economically active, i.e. the 12.5million people are grouped under (other). This includes kids that are in school as well as those studying, and those choosing not to work and not actively looking to work (think stay at home moms).
South Africa also has 15.3million people that are not economically active (that is they are of legal working age but not working at all). Of the 15.3million that are not economically active, 2.78million people are discouraged work seekers. Discouraged work seekers are those that want to work but cannot find work, but are looking. The rest of the 15.3million not economically active, i.e. the 12.5million people are grouped under (other). This includes kids that are in school as well as those studying, and those choosing not to work and not actively looking to work (think stay at home moms).
26 February 2018: Number of unemployed people per province as at Q4:2017
In today's update we will not be looking at the actual unemployment rate expressed in terms of percent, but we will look at actual raw numbers. Just how many people are unemployed in South Africa as a whole, and in all the provinces. The bar chart below shows the number of unemployed per province. And the pie chart following the bar chart shows the contribution each province makes to the overall number of unemployed people in South Africa.
As the bar chart above shows, Gauteng has by far the most number of unemployed people in South Africa, with 2.54million people in Gauteng sitting without a job. KwaZulu-Natal is in 2nd place with 1.74million people in KwaZulu-Natal sitting without a job. In third place is the Eastern Cape with 1.13million people in the Eastern Cape not having a job. For the country as a whole, there are 9.216million people in South Africa without a job. And note this is based on the expanded definition of unemployment. (I.e the numbers reported here includes those who have completely given up looking for work). We are reporting these numbers as this gives a truer reflection of the real unemployment problem in South Africa. If we reported the stricter number of unemployed (which excludes those who have given up looking for work), the number of unemployed as at the end of 2017 would be sitting at 5.88million.
So the difference between the strict definition and expanded definition of unemployment is 3.34million people. What that means is that an additional 3.34million people is not only without a job but has completely given up looking for work if one looks at the expanded definition of unemployment compared to the stricter version of unemployment. Conveniently for government the official unemployment rate is calculated using the stricter definition of unemployment (and the current unemployment rate is sitting at 26.7%). If the expanded definition of unemployment was used South Africa's unemployment rate would be sitting at 36.3% and not the 26.7% that is currently being reported. South Africa's unemployment problem is far worse than what government would have us all believe. The pie chart below shows the contribution to the total number of unemployed (using the expanded definition) per province.
So the difference between the strict definition and expanded definition of unemployment is 3.34million people. What that means is that an additional 3.34million people is not only without a job but has completely given up looking for work if one looks at the expanded definition of unemployment compared to the stricter version of unemployment. Conveniently for government the official unemployment rate is calculated using the stricter definition of unemployment (and the current unemployment rate is sitting at 26.7%). If the expanded definition of unemployment was used South Africa's unemployment rate would be sitting at 36.3% and not the 26.7% that is currently being reported. South Africa's unemployment problem is far worse than what government would have us all believe. The pie chart below shows the contribution to the total number of unemployed (using the expanded definition) per province.
The pie chart below provides a summary of the relative contribution of each province to the unemployment rate of South Africa, using the same data as in the bar chart above but representing it in a different format.
The pie chart above shows that Gauteng, while being South Africa's smallest province in terms of surface area, but SA's biggest province in terms of population, is also the province that contributes the most to South Africa's number of unemployed. With 27.5% of South Africa's unemployed people staying in Gauteng. Only 2.4% of South Africa's unemployed people reside in Northern Cape (South Africa's biggest province in terms of land area, but the smallest in terms of population numbers).
For more details on SA's provinces' see the following page: South Africa's population density map
For more details on SA's provinces' see the following page: South Africa's population density map
3 November 2017: Youth unemployment a massive problem
The graphic below provides a time series of the unemployment rate for various age groups, and from the graphic it is clear that youth and young adult unemployment rates are exceptionally high and does not bode well for South Africa's future as its actual working population (with all the experience and institutional know how) is getting older.
The question regarding South Africa's youth unemployment rate (aged 15-24) is whether the unemployment rate is so high as the majority of this group is still in school or continuing their studies at higher education facilities? Or is there a lot of youths just out of school actually looking for work to support their families but they cant find jobs? In the 3rd quarter of 2017, 52.2% of youths between ages of 15-24 were seen to be unemployed.
Young adults (aged between 25-34) had the second highest unemployment rate at 33.5%. This age group one would expect have finished their schooling as well as their higher education training such as Bachelors degrees. Yet a third of these young adults cannot find a job. Question is whether businesses are not creating enough jobs to absorb them, or are they not employable due to the level and quality of their education not meeting the demands and needs of employers?
The line chart above clearly shows the older you are the more likely you are to have a job in South Africa. Clearly showing that experience does count for something.
1 November 2017: South Africa's unemployment rate (Q3:2017)
Update (26 February 2018): Q4:2017
The interactive graphic below shows the unemployment rate of South Africa over time (up to the latest quarter available). And for the third quarter in a row it is holding out at historically high levels. For a third quarter in a row South Africa's official unemployment rate is sitting at 27.7%. When looking at the expanded definition of unemployment (where those who are unemployed and have given up finding jobs), South Africa's unemployment rate is actually at 36.8%. Thats more than 1 out of every 3 people in South Africa sitting without a job.
Concerning for South Africans should be the fact that the economy is growing exceptionally slowly (see our SA GDP page for more on South Africa's economy growth), and therefore not creating enough jobs to get those entering the labour market employed. See our education statistics page with regards to number of students obtaining qualifications. And this is leading to the ever increasing official unemployment rate. In years gone by there has been a massive influx of people into Gauteng, looking for jobs as it is the economic powerhouse of not only South Africa, but of Africa. But Gauteng's unemployment rat has been creaping up over the years. The graphic below shows the unemployment rate per province.
Unemployment rate per province (Q3:2017)
The graphic below provides an overview of South Africa's unemployment rate per province per quarter up to Q3:2017. And as mentioned earlier with regards to people coming to Gauteng seeking employment the unemployment rate for Gauteng has been increasing over time as the province is not creating jobs faster than the number of job seekers in the province is growing.
As at end of September 2017, the Eastern Cape has the highest official unemployment rate, while Limpopo has the lowest levels of unemployment. Gauteng which is the biggest employing province with 1.95million people working in the province, now have the 4th highest unemployment rate of all provinces (with roughly 819 000 people unemployed in Gauteng).
Recently Statistics South Africa has started publishing unemployment rates per metro in South Africa. This lower level data provides useful insights into the performance of various of South Africa's biggest cities. We take a look at the unemployment rate per metro per quarter below.
Unemployment rate per metro (Q3:2017)
Nelson Mandela Bay in the Eastern Cape is the city with the highest official unemployment rate,with it sitting at close to 36%, while eThekweni, which has been the metro with the lowest unemployment rate since Statistics South Africa started publishing data on metropolitan level has given up its place as the city with the lowest unemployment rate to City of Cape Town, who now has the lowest unemployment rate of all metros in South Africa.
Residents and businesses in the Eastern Cape must be concerned, as their two big metros are the two metros in South Africa with the highest levels of unemployment in South Africa. Car manufacturers leaving South Africa not helping their cause as the Eastern Cape is the car manufacturing hub of South Africa.
Unemployment summary per province
The image sourced from Statistics South Africa shows a brief summary of the labour market in each province of South Africa
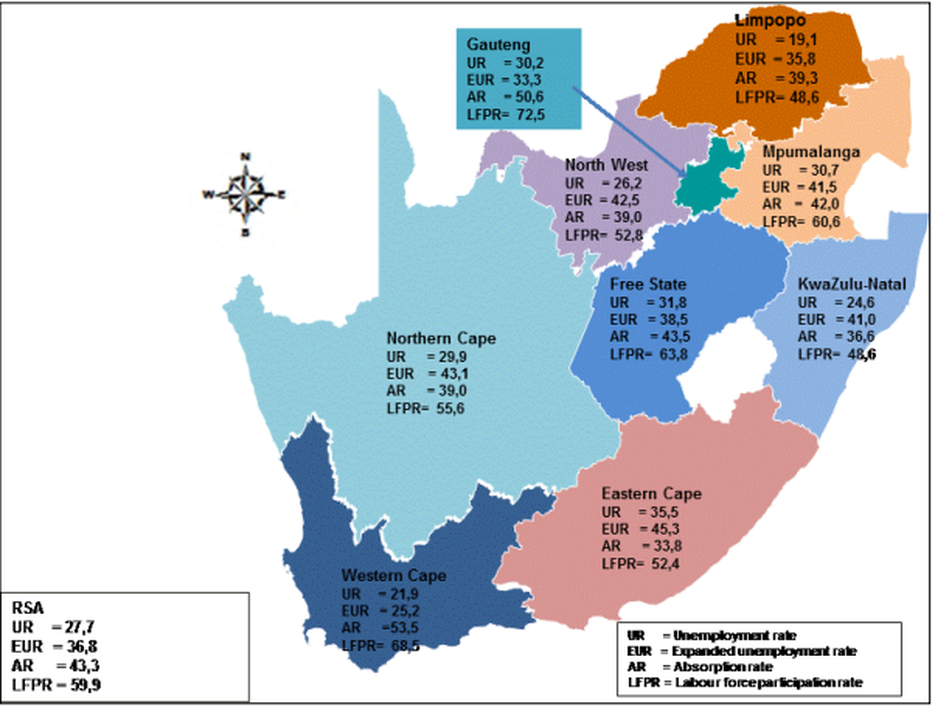
The Western Cape has the highest level of labour absorption rate in the country, while the Eastern Cape has the lowest level of labour absorption rates in South Africa.