South Africa's education statistics
|
Last updated: 18 April 2023
Category: Education This page is dedicated to supplying readers with more information regarding South Africa's education statistics and will be updated periodically as more information becomes available. |

|
18 April 2023: 18.3 million people of working age in South Africa are not in education or employment
According to the latest quarterly employment statistics there are around 18.3 million people of working age (15-64 years) that are not in education or employment (NEET). So 18.3 million people (a large part of them youths one would expect to be in school or post school education such as collegues and university) are not currently studying full time or working. That is a staggering amount considering the whole population of the country os ust under 61 million.
So lets take a look at the 18.3 million people in more detail. First up, what gender are they? Are there more males or females in this group?
So more than 50% of those in the NEET category are females, so a farely significant difference when looking at males versus females. Next lets look at the age categories for the 18.3 million people that are not currently in education or employment:
So 49.1% of the 18.3 million people currently not in education or employment are between the ages of 15 and 34. Basically the youth of South Africa. The next generation of South Africans that are to lead and take the country forward. Almost half of them are not currently studying or working. This is the single biggest problem the South African government needs to address. No jobs and no further education will ultimately lead to higher crime, more violence, fuller jails and a less productive society.
So lets take a look at the 18.3 million people in more detail. First up, what gender are they? Are there more males or females in this group?
- Females: 10 242 473 (55.9%)
- Males: 8 061 765 (44.1%)
So more than 50% of those in the NEET category are females, so a farely significant difference when looking at males versus females. Next lets look at the age categories for the 18.3 million people that are not currently in education or employment:
- 15-24 yrs:3 439 803 (18.8%)
- 25-34 yrs:5 546 401 (30.3%)
- 35-44 yrs:3 804 546 (20.8%)
- 45-54 yrs:2 725 012 (14.9%)
- 55-64 yrs:2 788 477 (15.2%)
So 49.1% of the 18.3 million people currently not in education or employment are between the ages of 15 and 34. Basically the youth of South Africa. The next generation of South Africans that are to lead and take the country forward. Almost half of them are not currently studying or working. This is the single biggest problem the South African government needs to address. No jobs and no further education will ultimately lead to higher crime, more violence, fuller jails and a less productive society.
2 November 2021: Higher education institution spends more on compensation of employees than what they receive in tuition fees
The summary below shows the compensation of employees as a ratio of tuition fees earned for each higher education institution. A ratio of 1 shows compensation of employees for the higher education institution is equal to the tuition fees received for the financial year. A ratio of greater than one shows the higher education institution spent more on compensation of employees than the tuition fees they received.
From the above it is pretty clear that most higher education institutions do not earn enough in tuition fees to pay their staff, and if it wasn't for grants and other receipts these institutions will never be able to stay afloat. As their current income from tuition is not nearly enough just to cover compensation of employees. Then expenses such as services and goods used, maintenance and repairs of buildings and grounds etc still has to be made. It shows what dire situation higher education institutions in South Africa are in.
Read the full article here
- Central: 2.87
- Tshwane: 2.85
- Sefako Makgatho: 2.60
- Cape Town: 2.43
- Sol Plaatje: 2.20
- Stellenbosch: 2.11
- Mpumalanga: 1.96
- Western Cape: 1.95
- Venda: 1.74
- Wits: 1.73
- Pretoria: 1.73
- Nelson Mandela: 1.59
- Limpopo: 1.58
- Johannesburg: 1.56
- Zululand: 1.49
- KwaZulu-Natal: 1.47
- Unisa: 1.44
- Cape Peninsula: 1.42
- North West: 1.39
- Rhodes: 1.34
- Vaal: 1.30
- Free State: 1.25
- Fort Hare: 1.22
- Mangosuthu: 1.07
- Durban :0.95
- Walter Sisulu: 0.94
From the above it is pretty clear that most higher education institutions do not earn enough in tuition fees to pay their staff, and if it wasn't for grants and other receipts these institutions will never be able to stay afloat. As their current income from tuition is not nearly enough just to cover compensation of employees. Then expenses such as services and goods used, maintenance and repairs of buildings and grounds etc still has to be made. It shows what dire situation higher education institutions in South Africa are in.
Read the full article here
27 July 2020: Access to smartphones and tablets for online learning
The image below obtained from Statistics South Africa (Stats SA) shows the results from a survey conducted tracking the impact of Covid-19 on households. A short summary of the image below as obtained from Stats SA. In 75,9% indicated that they had smart phones that could be used for home learning. 36,1% had access to tablets and 61,2% to laptops.
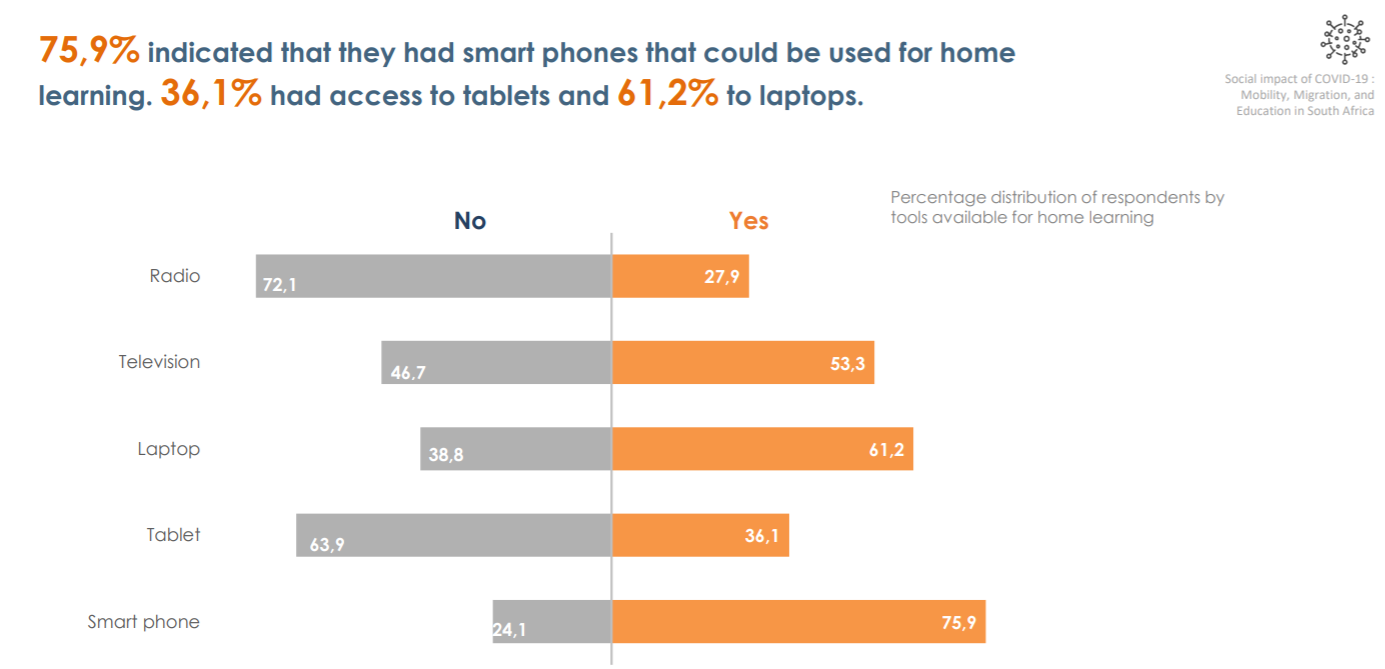
75.9% of respondents indicated that they had access to smart phones that could be used for home learning
26 February 2020: Millenials field of study at university (as at 2018)
The image below shows the field of study of Millennials aged between 23-38 attending university by field of study, as obtained from the Department of Higher Education.
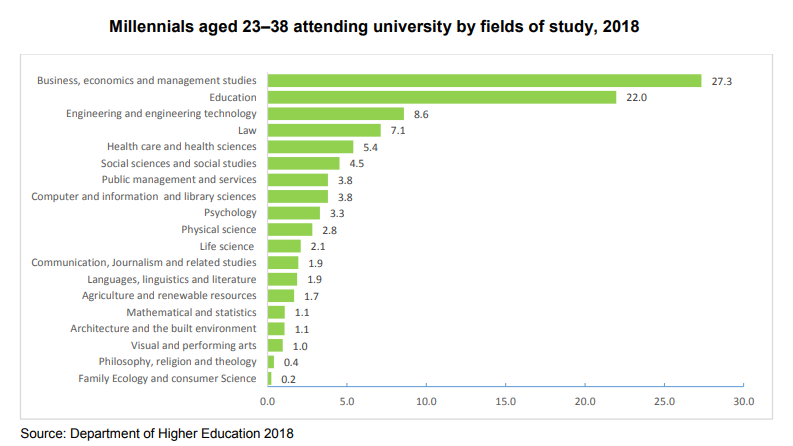
According to Statistics South Africa they had the following to say regarding the field of study of Millennials (born between 1980 and 1999) and Generation X (born between 1969 and 1979)
An improvement in enrolment in engineering at 8,6% was observed among Millennials with a close to four percentage points increase as compared to enrolment among individuals in Generation X. Family ecology ,philosophy, religion and theology, and visual and performing arts had the lowest percentage of enrolment among Millennials.
An improvement in enrolment in engineering at 8,6% was observed among Millennials with a close to four percentage points increase as compared to enrolment among individuals in Generation X. Family ecology ,philosophy, religion and theology, and visual and performing arts had the lowest percentage of enrolment among Millennials.
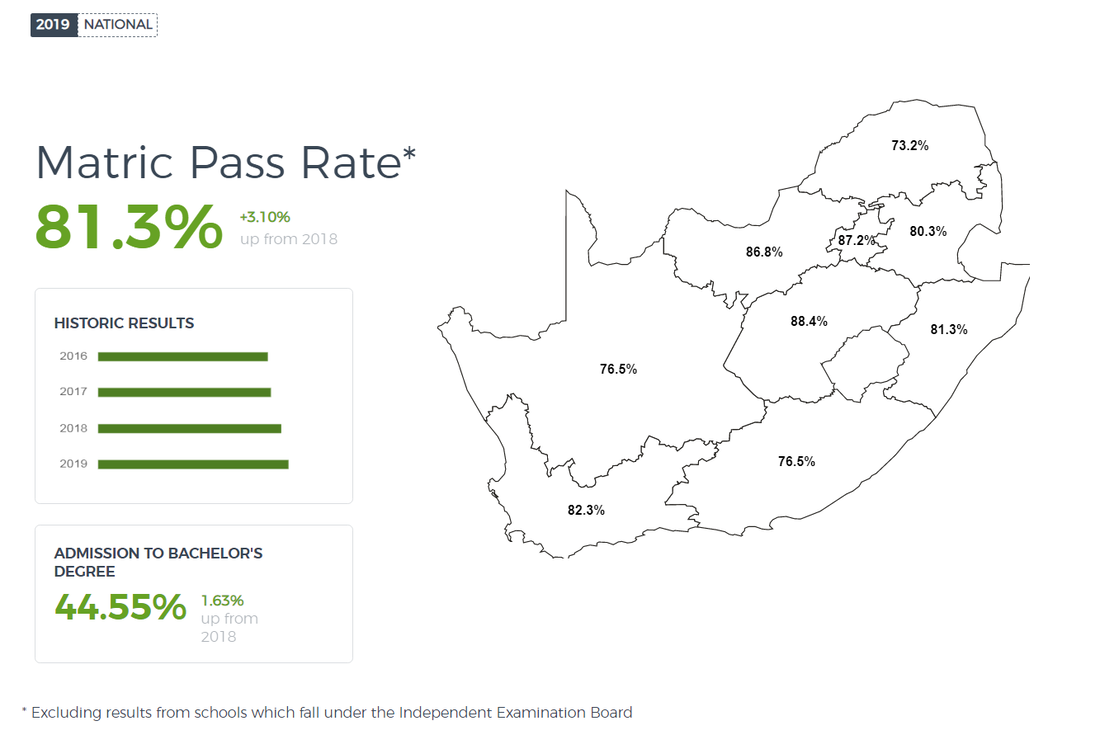
8 January 2020: Department of Basic Education (DBE) 2019 matric results
The DBE matric class of 2019 achieved a pass rate of 81.3%, up from 78.2% in 2018. But the number should be seen in context. in 2017, a total of 1 052 080 learners were enrolled in grade 10, yet only 409 906 learners eventually passed matric last year. The map below shows the pass rate per province for 2019. And as it shows that 44.55% of matrics that passed , passed with a grade high enough for admission to bachelors degrees.
The pass rate for South Africa's 9 provinces is summarised below: (Note these numbers on the map below excludes students from Independent Examination Board.
Below a graphical representation of the summary above
The pass rate for South Africa's 9 provinces is summarised below: (Note these numbers on the map below excludes students from Independent Examination Board.
- Western Cape: 82.3%
- Eastern Cape:76.5%
- Northern Cape: 76.5%
- Free State: 88.4%
- KwaZulu-Natal: 81.3%
- North West: 86.8%
- Gauteng: 82.2%
- Mpumalanga: 80.3%
- Limpopo: 73.2%
Below a graphical representation of the summary above
Matric 2019 pass rate per province in South Africa
8 January 2020: Independent Election Board (IEB) 2019 matric results
IEB National Senior Certificate 2019
The 2019 pass rate is 98.82%, comparable to last year’s pass rate of 98.92%. All candidates who passed achieved a pass that is good enough to enter tertiary study at one of the three levels:
11818 full-time and 779 part-time candidates from 227 examination centres across Southern Africa wrote the Independent Examinations Board (IEB) National Senior Certificate (NSC) examinations in October and November 2019. This is an increase from 2018 when there were 11 514 full-time candidates and 858 part-time candidates.
Advanced Programmes 2019The Advanced Programme courses are extension courses in Mathematics, English and Afrikaans. They are available to any learner in South Africa attending either state or independent schools that choose to participate. The assessment has been benchmarked by UK NARIC, the UK equivalent of the South African Qualifications Authority, and is considered equivalent to the UK A-levels.
The 2019 performance in AP Mathematics, consisting of 1351 learners from IEB schools and 993 learners in state schools, has been very pleasing with 67.36% achieving a pass above 40%. From a total of 624 learners offering AP English, 93.86% achieved a pass mark of 50% or above; all learners offering AP Afrikaans achieved a mark of 40% and above.
The IEB has 11 818 full-time and 779 part-time candidates in Grade 12 in 2019, registered at 227 IEB examination centres across the country, Mozambique, Namibia and Eswatini as follows:
The 2019 pass rate is 98.82%, comparable to last year’s pass rate of 98.92%. All candidates who passed achieved a pass that is good enough to enter tertiary study at one of the three levels:
- 89.51% (compared to 90.65% in 2018) of the cohort achieved entry to degree study.
- 7.91% (compared to 7.33% in 2018) qualified for entry to diploma study.
- 1.4% (compared to 0.95% in 2018) achieved entry for study at the Higher Certificate level.
11818 full-time and 779 part-time candidates from 227 examination centres across Southern Africa wrote the Independent Examinations Board (IEB) National Senior Certificate (NSC) examinations in October and November 2019. This is an increase from 2018 when there were 11 514 full-time candidates and 858 part-time candidates.
Advanced Programmes 2019The Advanced Programme courses are extension courses in Mathematics, English and Afrikaans. They are available to any learner in South Africa attending either state or independent schools that choose to participate. The assessment has been benchmarked by UK NARIC, the UK equivalent of the South African Qualifications Authority, and is considered equivalent to the UK A-levels.
The 2019 performance in AP Mathematics, consisting of 1351 learners from IEB schools and 993 learners in state schools, has been very pleasing with 67.36% achieving a pass above 40%. From a total of 624 learners offering AP English, 93.86% achieved a pass mark of 50% or above; all learners offering AP Afrikaans achieved a mark of 40% and above.
The IEB has 11 818 full-time and 779 part-time candidates in Grade 12 in 2019, registered at 227 IEB examination centres across the country, Mozambique, Namibia and Eswatini as follows:
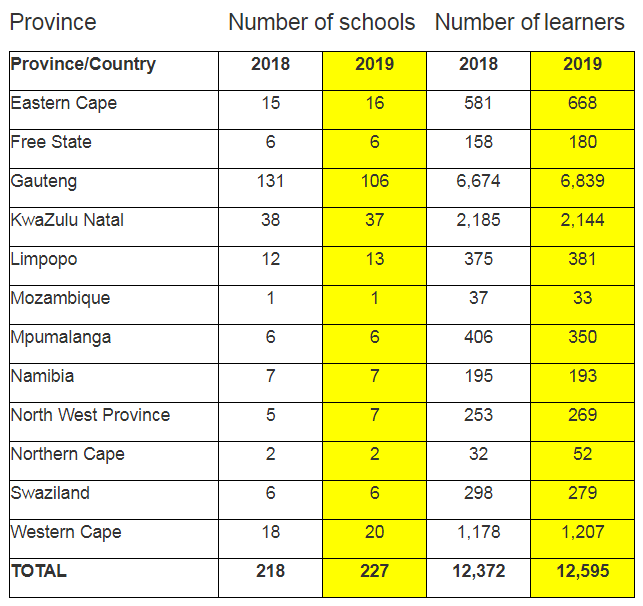
The total number of examination venues was 270, which includes centres that deal only with part-time candidates and centres that host more than one examination venue. The Gauteng numbers include learners registered with three distance-learning institutions which have their head offices in Gauteng. These institutions have both full-time and part-time learners who live in areas across the country. They are registered with the distance-learning institution which manages their lesson delivery as well as the assessment requirements, and in Grade 12 these adhere strictly to the NSC requirements and are moderated and verified by the IEB.
12 November 2019: Salaries paid by higher education institutions
The graphic below shows the expenditure on compensation of employees (basically salaries) by the 26 higher education institutions in South Africa. The biggest spender on salaries in 2018 was Unisa at R5.1 billion, 2nd biggest spender on salaries was the University of Pretoria (TUKS) with R3.5 billion and the 3rd biggest spender was University of Cape Town (UCT) with R3.3 billion spent on salaries
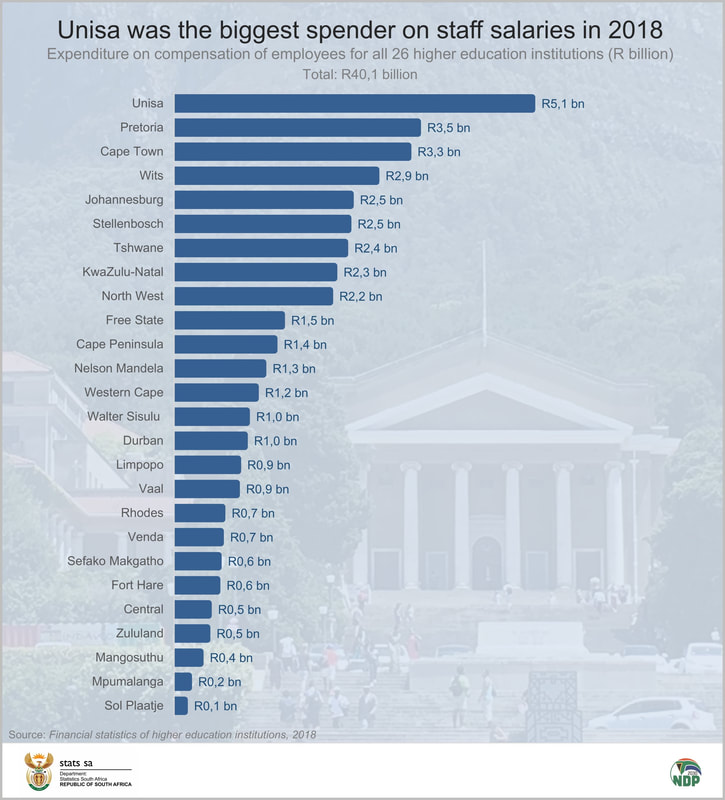
Amount of money spent per higher education institutions in South Africa on salaries
Now looking at some of the higher education institutions that spent a lot less on higher education. University of Venda (UNIVEN) and Rhodes University spent R700 million on salaries in 2018 while Fort Hare in the Eastern Cape spent R600 million on salaries during 2018. In total higher education institutions spent R40.1 billion in 2018 on compensation of employees.
29 May 2019: Problems experienced in public schools by learners
The table below shows some of the main problems experienced by learners in public school per province during the 2018 school year. Nationally, classes that were considered too large (3,3%), a lack of books (2,8%), and high fees (2,6%) were singled out as the most important problems. These were followed by bad facilities (2,1%) and lack of teachers (1,6%). Learners in Western Cape (6,7%), North West (5,6%), and Mpumalanga (4,3%) were most concerned about large class sizes.
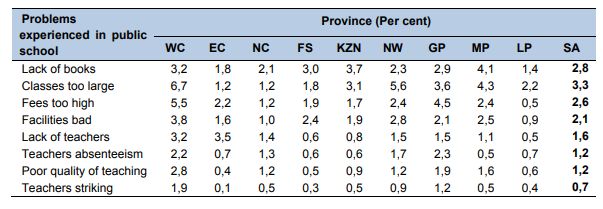
Furthermore, learners in Western Cape (5,5%) and Gauteng (4,5%) were most likely to complain about high fees. Learners in Eastern Cape (3,5%) were most likely to complain about a lack of teachers. Sadly striking teachers made the list of learners biggest concerns too. With 0.7% of all learners in public schools citing striking teachers as a problem.
29 May 2019: Education statistics based on General Household Survey (GHS) 2018
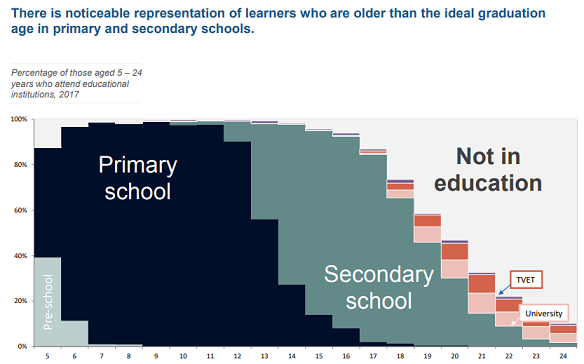
This update is based on the latest results from the General Household Survey (GHS) as published by Statistics South Africa. It shows per youth age the percentage of children and youths in various educational facilities or whether they are not in any educational facility. For example for children aged 5 years old in South Africa, 15% of them are not in education, 54.2% of children aged 5 years old are in primary school, and 30.25 of children aged 5 years old is in pre-school.
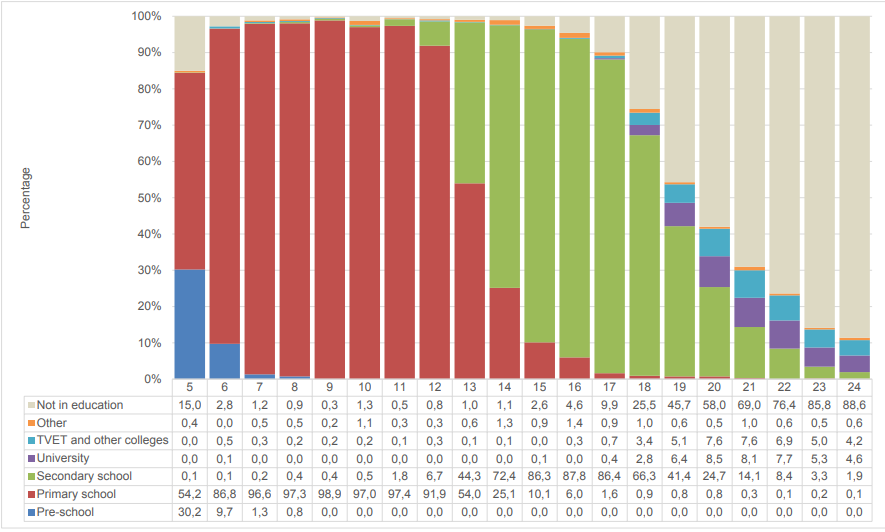
Percentage of youths in South Africa in various educational facilities
Lets take a look at those youths that are 19 years of age. Where exactly do they find themselves? 45.7% of youths aged 19 is not in education. And this is the sad and depressing statistic. This is the age at which youths should be enrolled in TVET and Universities. 41.4% of youths aged 19 years are currently attending secondary school (or high school), and only 6.4% of youths at age 19 is attending or is enrolled at University.
Advertisment
15 May 2019: Youth unemployment rate higher irrespective of level of education
Yesterday Statistics South Africa released the latest unemployment numbers obtained from their quarterly labour force survey. In the results release, they showed that youth unemployment was highest irrespective of their level of education compared to older citizens in South Africa. The image below shows the unemployment rate for youths (bars to the far left per level of education and compares the respective unemployment rates per level of education with that of other ages groups).
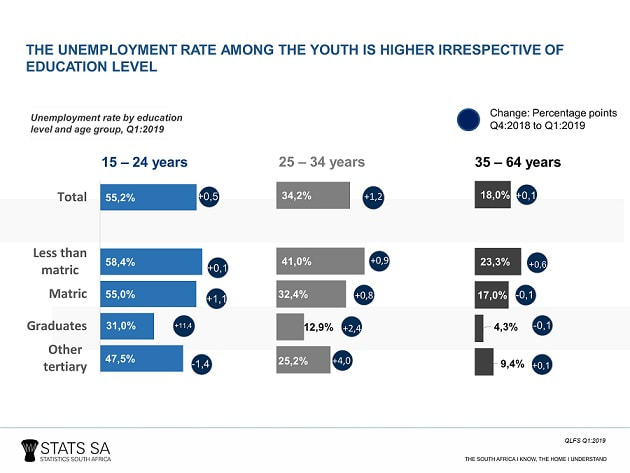
From the above it is clear that youth's are far less likely to find a job or to be absorbed in the job market than those that are older. The question is why this is the case and whether something can be done about this to reverse this trend? Does the youth expect to much in terms of first paying job salaries, or what they will be doing when they enter the job market? Or does the total lack of experience count against them and firms would rather employ older people who have more work experience? It is a fascinating topic and we wish Stats SA would ask employers why they tend to employ older people instead of the youth so that we can get a sense of why this is the case and what needs to be done to address it.
22 April 2019: Statistics South Africa article on funding issues for students
The article below was published by Statistics South Africa (Stats SA) and highlights the funding issues experienced by students, in particular those looking to attend higher education institutions.
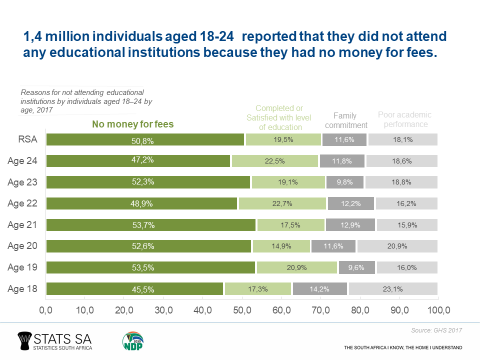
More than half (or 51%) of youth aged 18–24 claimed that they did not have the financial means to pay for their tuition. Furthermore, 18% of those aged 18–24 who were not attending educational institutions indicated that their poor academic performance prevented them from participating. This is according to the “Higher Education and Skills in South Africa” report released by Statistics South Africa
More than half (or 51%) of youth aged 18–24 claimed that they did not have the financial means to pay for their tuition. Furthermore, 18% of those aged 18–24 who were not attending educational institutions indicated that their poor academic performance prevented them from participating. This is according to the “Higher Education and Skills in South Africa” report released by Statistics South Africa
The report, which uses data from the General Household Survey (GHS) 2017, indicates that only 33,8% of youth aged 18–24 were attending educational institutions. Among those, 22,2% were attending school while 11,6% were attending post-school educational institutions.
In 2017, only three-quarters of male students who attended Grade 10 in 2016 progressed to Grade 11, while the same was true for close to 87% of female learners. During the same period, even fewer males (71%) who attended Grade 11 in 2016 progressed to Grade 12 the following year, while 76% of the females did the same.
The report shows that the general trend in participation in all institutions of post-school learning was upward, with total enrolment in higher education institutions in 2016 amounting to 49,9% of all enrolments within the sector; TVET colleges amounted to 30,8% of all enrolments; CET colleges 11,9% of all enrolments; and private colleges 7,4% of all enrolments within the sector.
Despite gains in higher education participation rates, gender disparity was still a challenge, as was participation equity for students from low-income backgrounds. Female participation in 2016 at public higher educational institutions (universities) was 58%, and 57% at TVET colleges. Most students were enrolled in undergraduate NQF Level 7 programmes at universities, mostly studying for qualifications in the fields of business, commerce and management sciences, education or engineering. Most students enrolled at TVET colleges in 2016 were studying for Report 191 qualifications. NATED / Report 191 programmes are delivered under the auspices of the Department of Higher Education and Training and quality assured by Umalusi. The programmes consist of 18 months of theoretical studies at colleges and 18 months relevant practical application in work places. Engineering studies range from N1 – N6 while Business and Utility Studies range from N4 – N6.
According to the report, the number of graduates from public higher universities more than doubled from 92 874 in 2000 to 203 076 in 2016. In 2016, the number of graduates from TVET and private colleges stood at 135 492. The time taken by students to complete their undergraduate qualifications also improved over time. However, the higher education system still has challenges in terms of their success rates and poor completion rates. Many students drop out without completing a qualification, or they take up to six years to complete a three-year qualification. Very few students progress to advanced NQF levels of study (NQF levels 8–10). Honours (19,8%), masters (6,3%) and doctoral studies (1,4%) accounted for a relatively small percentage of the overall tertiary qualifications awarded in 2016.
According to the report, close to 47% of youth aged 20–24 years who held bachelor degrees or qualifications equivalent to NQF Level 7 came from the highest household income quintile. In comparison, only 7,4% of youth who held qualifications equivalent to NQF Level 7 came from the lowest household income quintile. Furthermore, close to 36% of youth holding postgraduate degrees or qualifications equivalent to NQF Levels 8–10 came from the highest household income quintile.
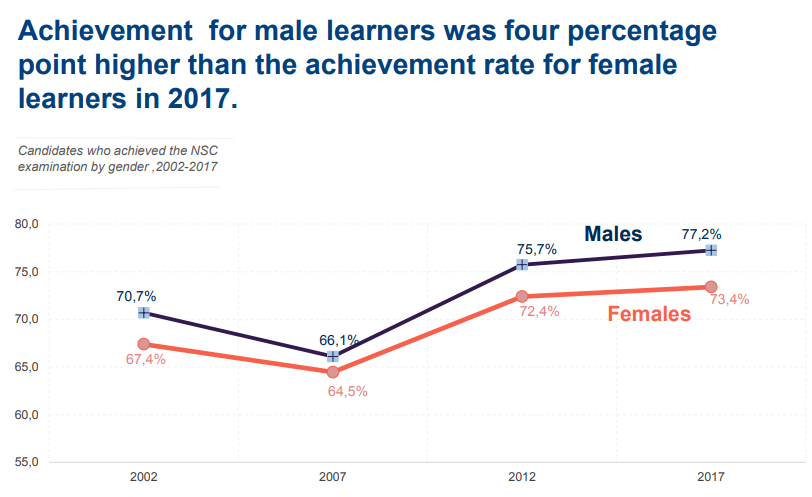
28 March 2019: Males vs Females in terms of overall market achieved
Based on a education series document published by Statistics South Africa, mail learners tended to achieve better overall marks than their female counterparts. In 2017 males achieved almost 4 percentage points more on average than their female counterparts. See the image below.
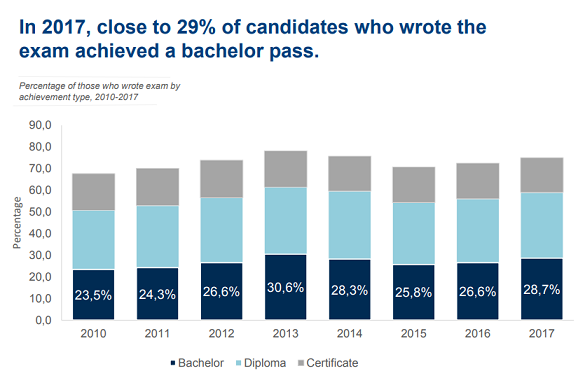
Ever wondered what percentage of those passing matric passed with grades good enough to be accepted to do a Bachelors degree at University? According to the data in 2017, 28.7% of those that passed passed with grades good enough to be accepted into University to study a Bachelors degree as the image below shows.
In our update on 18 March 2018 we mentioned the problem South Africa has with NEET, those youths not in employment, education or training. Well the image below assists in highlighting the NEET problem in South Africa. The grey block to the top right which says Not in Education is a large comprised of those not in employment, education or training. It also shows a large chunk of those falling under NEET belongs to the age group 23-24 year olds.
And at the end of the day it seems education is all about the money. Youth aged 18–24 residing in Free State, KwaZulu-Natal, North West, Gauteng and Mpumalanga, cited lack of money for school fees as the principal reason for not attending any educational institution in 2017. For South Africa as a whole 51% of youths (aged 18 -24) said money is the main reason they are not attending an educational institution in 2017. The map below shows the percentage of youths per province who cited money as the reason for not attending an educational institution.
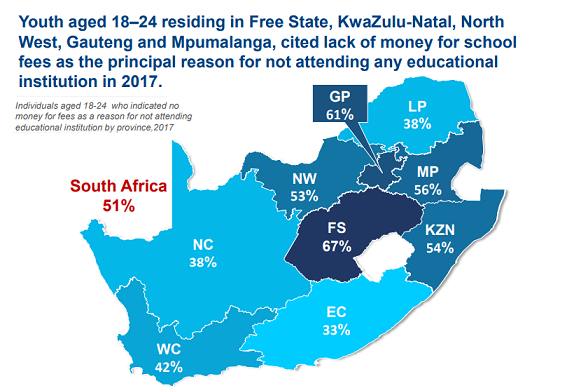
The summary below shows the percentage of youths (18-24 year old) that stated money is the main reason they are not attending an educational institution (source is GHS 2017)
- Free State: 67%
- Gauteng: 61%
- Mpumalanga: 56%
- KwaZulu-Natal: 54%
- North West: 53%
- South Africa: 51%
- Western Cape: 42%
- Northern Cape: 38%
- Limpopo: 38%
- Eastern Cape: 33%
18 March 2019: South Africa's NEET problem
According to the report released by the commission of inquiry into the provision of free higher education, South Africa has a significant NEET problem. NEET is a acronym used to describe a certain subset of youths in South Africa. Not in employment, education or training (NEET). So its those youths who are unemployment, not studying further (after school) and not currently receiving any form of training to get them into the jobs market. The funnel graphic below shows South Africa's NEET problem. In 2014 South Africa had 3 million youths between the age of 18-24 who was classified at NEET.
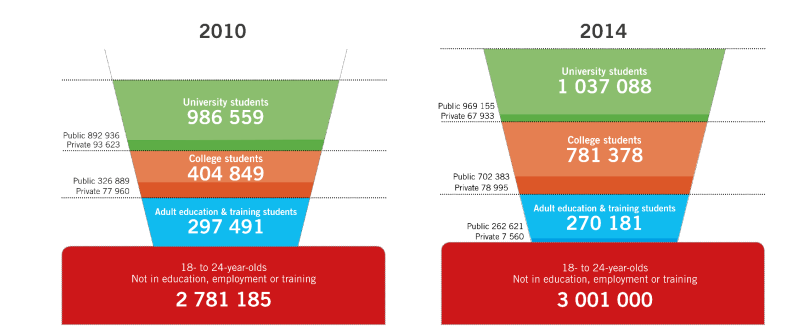
The sad reality is South Africa doesn't have enough education facilities to accommodate all these youths, neither do they or their parents have the money to get them into higher education and training facilities such as Universities or technical schools. Problem this creates is the fact that a large part of these youths will turn to crime, drugs etc to feed themselves and their families, leading to even bigger social problems in South Africa. If you in a University of receiving further education and training and you are between the age of 18-24 be very very grateful as there are millions less fortunate than you.
13 February 2019: South African universities in the world rankings
In this update we take a look at where South African Universities rank in the world rankings as calculated by the Acedemic Ranking of World Universities (ARWU). ARWU uses six indicators to rank Universities. Over 1 300 Universities are ranked and they Top 800 are published. So where do South African Universities fall in the ARWU world rankings? Below a summary of some of South Africa's highest ranking universities:
- University of Cape Town (UCT): 229
- University of WitwatersRand (Wits): 317
- University of KwaZulu-Natal (UKZN): 349
- Stellenbosch University (SU): 421
- University of Pretoria (UP): 459
- University of Johannesburg (UJ): 655
- North West University: 808
9 January 2019: Public vs independent schools
In this update we take a look at the numbers provided by the Department of Basic education regarding the number of public and independent schools, learners in public and independent schools as well as the number of educators in public and independent schools. And the numbers for public schools are extremely worrying.
School Type |
Number of learners |
Number of educators |
Number of schools |
Public |
12 490 132 |
399 156 |
23 796 |
Independent |
402 141 |
34 164 |
1 966 |
So lets compare the numbers. In public schools, there are 31.3 learners per educator and on average 524 learners per public school, while for independent schools there are 11.8 learners per educator and on average every independent school has 204.5 learners. So far more students attending at the average public school, and almost 3 times as many learners for each public school educator to deal with than those working at independent schools.
7 January 2019: Enrollment in Mathematics, Economics and Accounting over time in SA
In this update we take a more detailed look at the enrollment and pass rate numbers for three subjects we are very keen on on this website, which is economics, mathematics and accounting. Just how many students are enrolling for these exams and what percentage of students actually pass these subjects? We take a look below.
When looking at the student enrollment rates over the last year, all three subjects has seen a decline in the number of students enrolling to write the Mathematics, Accounting and Economics NSC exams. The difference in raw numbers between 2017 and 2018 for the three subjects are as follows:
In 2018 the following "pass rates" where achieved when using the 30% "pass" mark.
In 2018 the following "pass rates" where achieved when using the 40% mark as a "pass"
We as South Africans need to take a long hard look at these numbers and ask how are we ever going to be competitive against other countries in terms of education levels and giving our children a fair chance in the ever increasing open jobs market when marks like these are achieved? Our current levels of education is surely the single biggest problem that needs to be addressed in South Africa if it is to give its citizens a fair chance at employment.
- Accounting: -11 596
- Economics: -11 595
- Mathematics: -5 568
In 2018 the following "pass rates" where achieved when using the 30% "pass" mark.
- Accounting: 72.5%
- Economics: 73.3%
- Mathematics: 58%
In 2018 the following "pass rates" where achieved when using the 40% mark as a "pass"
- Accounting: 48.6%
- Economics: 44.8%
- Mathematics: 37.1%
We as South Africans need to take a long hard look at these numbers and ask how are we ever going to be competitive against other countries in terms of education levels and giving our children a fair chance in the ever increasing open jobs market when marks like these are achieved? Our current levels of education is surely the single biggest problem that needs to be addressed in South Africa if it is to give its citizens a fair chance at employment.
4 January 2019: Matric results 2018
The following is quoted from the Minister of Basic Education's speech at the launch of the 2018 matric results.
For the past eight years, we have noted that the NSC pass rate has consistently been above the previous 70% glass ceiling. The Class of 2018 must be commended for maintaining this trend. They are the fourth largest cohort in the history of basic education to register for any NSC examination in the country.
The 2018 NSC overall pass rate, with the progressed learners included, stands at 78.2%, a 3.1% improvement from the 75.1% achieved in 2017. This, represents 400 761 candidates, who had passed the 2018 NSC examination. However, with the progressed learners excluded, the 2018 NSC overall pass rate stands at 79.4%, a 2.9% improvement from the 76.5% achieved in 2017. Well done to the Class of 2018!!!
Further analysis of the 2018 NSC examination results, show that –
- the number of candidates qualifying for admission to Bachelor studies is 172 000, which represents 33.6% of the total number of candidates, who wrote the 2018 NSC examinations;
- the number candidates, who passed with a Diploma is 141 700, which represents 27.6% of the total number of candidates, who wrote the 2018 NSC examinations;
- the number of candidates who passed with Higher Certificate is 86 800, which represents 16.9% of the total number of candidates, who wrote the 2018 NSC examinations; and
- the number of candidates who passed with a National Senior Certificate (NSC) is 99; and the number of candidates who passed with an endorsed NSC is 129.
The national pass rate per province:
- Free State: 91.1%
- Gauteng: 89%
- Western Cape: 83.2%
- North West: 83.8%
- Northern Cape: 75.2%
- Mpumalanga: 80.4%
- Kwazulu-Natal: 76.8%
- Limpopo: 70.6%
- Eastern Cape: 71.4%
So of the 800 800 students who registered for the NSC exams, only 172 000 qualified for further studies at universities. So just over a third of the students that wrote matric actually qualify to go to university. While the department of basic education might brag about the impressive pass rate (which is impressive due to the fact that the score required to be deemed a pass) keeps being lowered and lowered. So no wonder the percentage of students passing keeps on increasing. Students who do not qualify for varsity will struggle to get employment in South Africa without a degree. And if they do get work without a degree it will not be a decent paying job. They will be working for peanuts. So the actually the matric results is a complete failure and the department of basic education has let thousands upon thousands of students down.
In 2016 there was around 1.2 million people in grade one students. If the same amount of grade 1 students were in grade 1, 12 years ago, it means that only about 30% (400 000 odd that passed divided by the 1.2 million in grade 1 now) of pupils who start school in grade 1 actually make it all the way and pass matric. That department of basic education is absolutely nothing to be proud of.
Look at it this way, in 2016 there were 1 067 075 pupils in grade 10. And only 400 761 passed matric. So that is a pass rate of 37.56%. Basically only 385 of pupils that were in grade 10 in 2016 passed matric in 2018. A shockingly bad figure that the department should be ashamed about.
21 December 2018: A quick did you know about Accounting in SA schools
So ever wondered how Marcus Jooste and his gang of thieves got away with their elaborate accounting and fraud schemes at Steinhoff? Well the scores of matric students in the subject of accounting tells a very concerning picture. In 2017, 103 427 students wrote the matric exams for accounting. and only 44 041 students scored more than 40% in accounting. That means that less than half the students that wrote the accounting exam scored more than 40%. And 40% is still a fail in our book. Now if basic accounting such as school accounting cannot be teached/grasped/mastered by school kids how are they (when they become CA's and auditors) expected to pick up large scale fraud as was the case at Steinhoff with loads of off balance sheet transactions, over valued business valuations and the like?
The table below shows the overall achievement of South African matric students in Accounting for the last couple of years.
The table below shows the overall achievement of South African matric students in Accounting for the last couple of years.
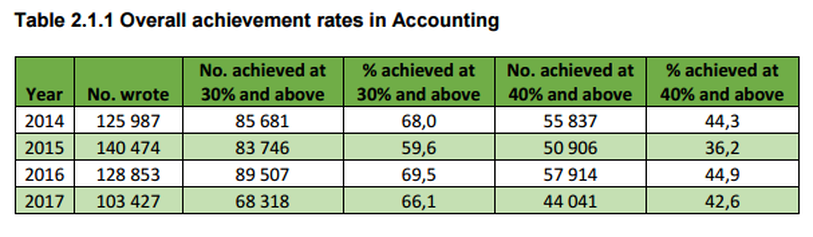
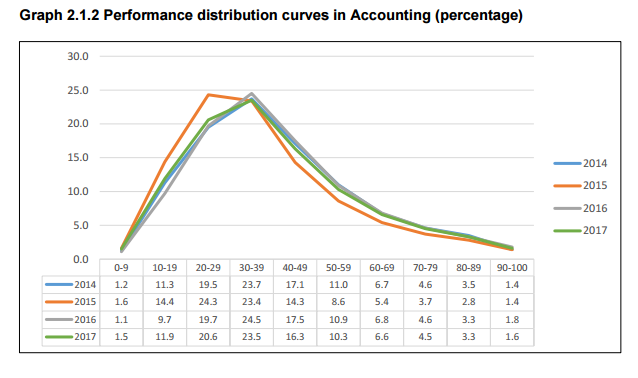
The line graphic below shows the percentage of students that scored within each 10% range for accounting over the last couple of years. If distinctions are seen as scores above 80%, then only 4.9% of matric students that wrote Accounting received distinctions for it. Expect loads more accounting scandals to come out in coming years if this is the quality of Accounting in South Africa.
31 October 2018: Higher education institutions continues to cut capital spending
Worrying for future higher education students is the fact that these institutions are cutting back on their capital spending, as the article published by Statistics South Africa will show. Perhaps these institutions are cutting back on such spending, as they know with the next protest regardless of what it is about will result in destruction of property and assets, so why upgrade, maintain or fix them when it will be damaged again? Below the article from Statistics South Africa (Stats SA).
Start of Article
"Capital expenditure by South Africa’s higher education institutions continued to fall, for the second consecutive year. The country’s 20 universities and 6 universities of technology recorded a 5,4% drop in capital expenditure in 2017 compared with 2016, falling from R6,22 billion to R5,89 billion. This followed a 0,7% drop in 2016, according to Stats SA’s recent Financial statistics of higher education report.
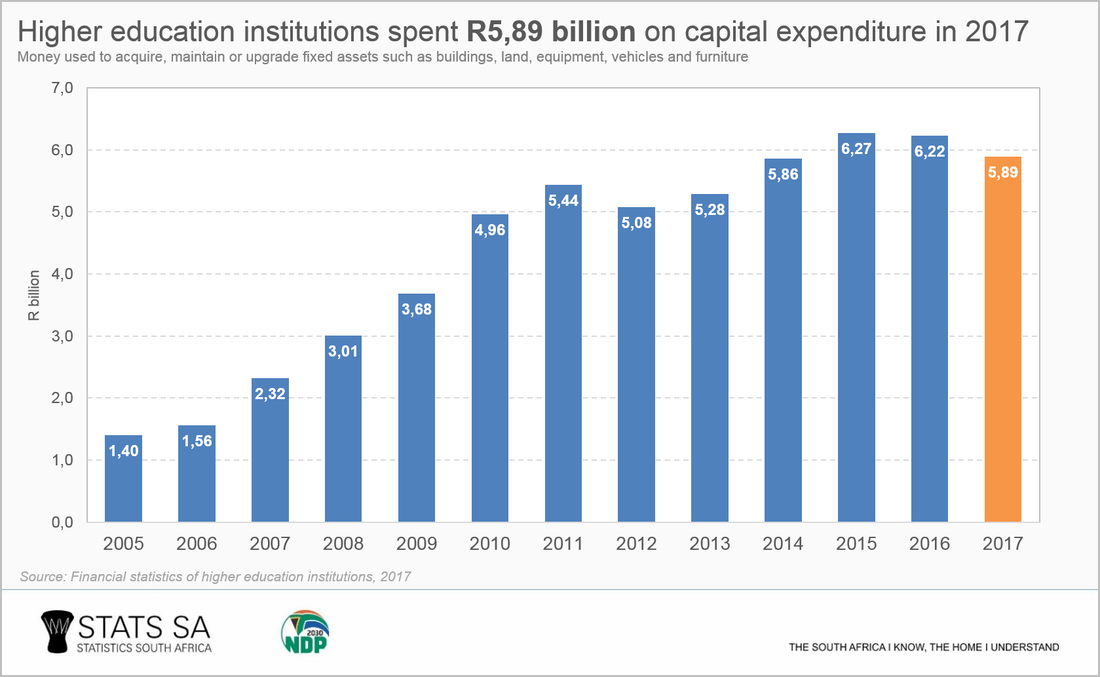
Capital expenditure is money that an institution spends to acquire, maintain or upgrade fixed assets such as buildings, land, equipment, vehicles and furniture. These assets generally increase the capacity and efficiency of the institution, and usually have a life span of longer than a single accounting period. The amount that an institution spends on fixed assets shows the extent to which it’s investing in the long term.
The drop in higher education capital expenditure mirrors the pull-back in spending on fixed assets by the public sector. Stats SA’s Capital expenditure by the public sector report for 2017, drawing on financial data from 751 institutions, recorded the first annual decline in public-sector capital expenditure since 2010. Subdued spending on plant, machinery, new construction works and transport equipment was largely the cause of the fall.
In terms of higher education, the 5,4% drop in 2017 was largely a result of decreased spending by the University of the Witwatersrand (Wits), the University of South Africa (Unisa) and the Walter Sisulu University. These three institutions spent less on buildings, transport equipment, office furniture and other machinery and equipment.
Who were the biggest spenders on fixed assets in 2017? The University of Pretoria took the lead, contributing R738 million (or 13%) to total higher education capital expenditure. Stellenbosch University and the University of Mpumalanga took second (10%) and third (9%) spots, respectively. The bulk of capital expenditure (63%) was directed towards the construction and maintenance of buildings such as laboratories, lecture halls and residences. The second most important item was furniture, taking up 14% of the R5,89 billion (see image below for more details)
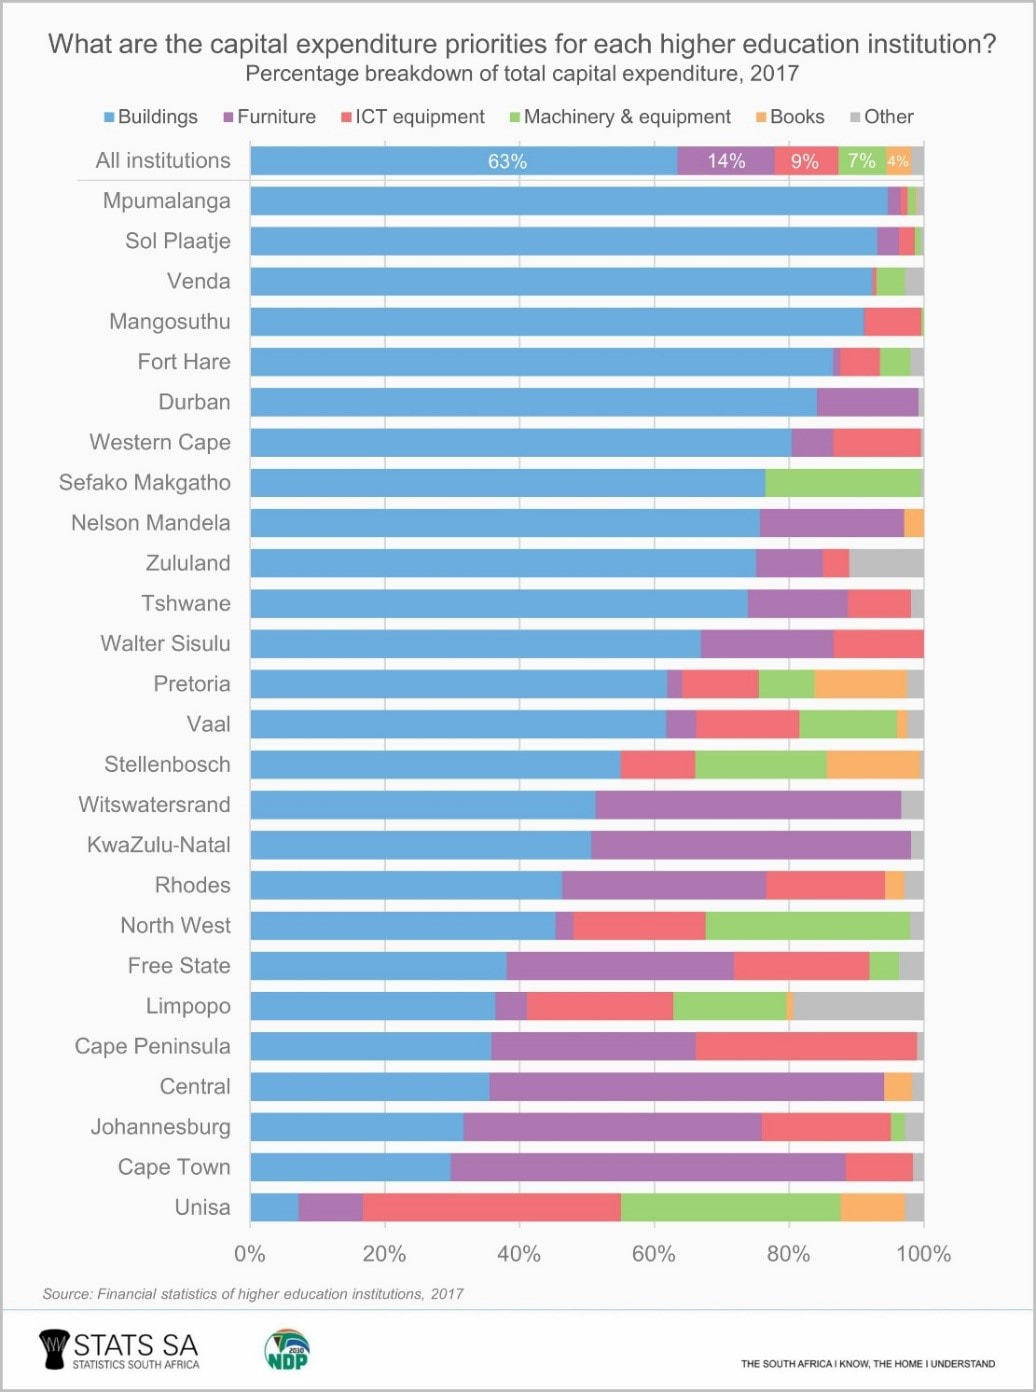
Capital expenditure priorities differ across institutions. The University of Mpumalanga spent 95% of its capital expenditure on buildings, while Sol Plaatje University spent 93%. In contrast, Unisa spent a small proportion on buildings, instead focussing on ICT equipment and machinery and equipment. The decrease in overall capital expenditure can be attributed to various reasons. Wits, for example, indicated that it had reduced capital expenditure in order to conserve money for increased maintenance costs. The institution would also redirect any surplus cash towards its insourcing programme, the process of absorbing staff that were previously employed by third-party contractors.
Original article can be found here: Capital spending declining at higher education institutions
End of article
Original article can be found here: Capital spending declining at higher education institutions
End of article
23 June 2018: Latest education statistics from General Household Survey (GHS)
This update takes a look at the results of the latest General Household Survey (GHS) published by Statistics South Africa and the information relating to education. The table below published by Statistics South Africa shows various metrics related to education.
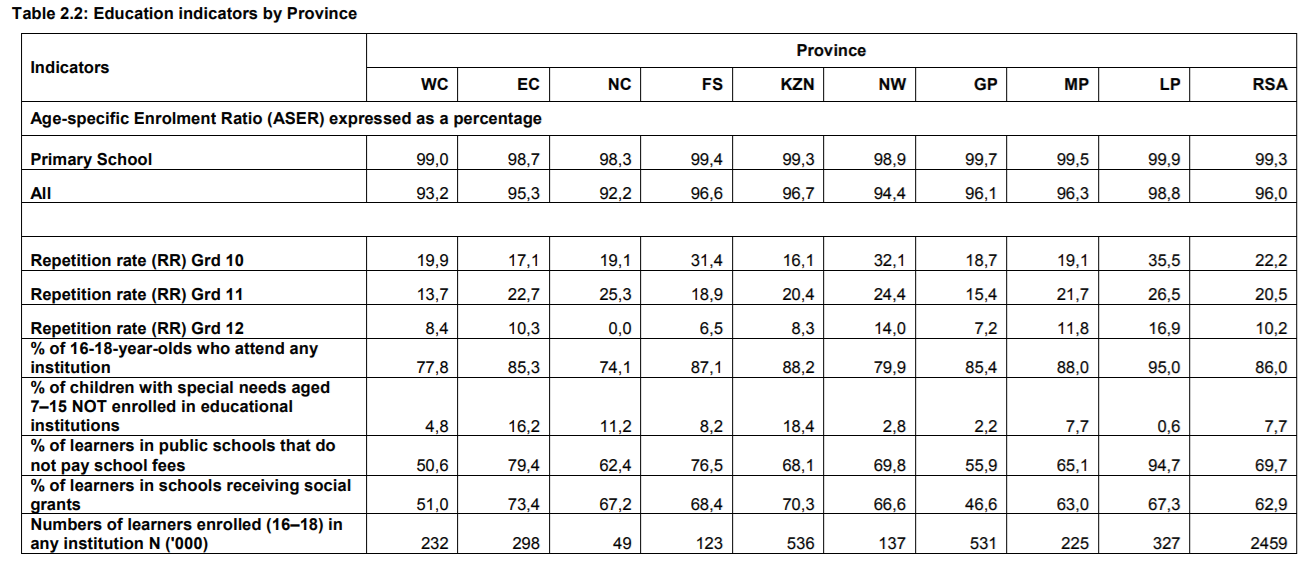
The worrying number from the table above is the Repetition rate (RR) of Grd 10 's which is sitting with 22.5%, basically saying 22.5% of households in South Africa reported they have a child repeating Grd 10 and 20.5% of households stated that they have a child repeating Grd 11. Note the results of the GHS is based on a sample of households selected. There will therefore be some bias built into the numbers (selection/sample bias), reporting bias etc. The numbers above are therefore the best estimate of the population as a whole based on the selected sample.
The table below is a continuation of the table above, showing additional metrics related to education in South Africa.
The table below is a continuation of the table above, showing additional metrics related to education in South Africa.
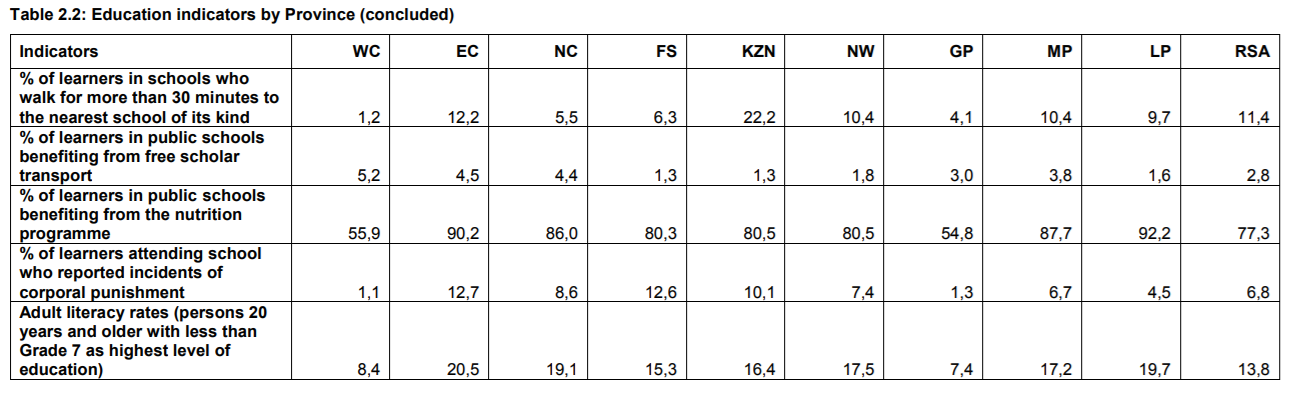
In total 11.4% of households reported children work for longer than 30 minutes to the nearest school. 22.2% of households in KwaZulu-Natal reported children work for more than 30 minutes to get to school, while only 1.2% of households in the Western Cape reported children walked more than 30 minutes to get to school.
Another worrying statistic for South Africa is the adult literacy rate, which is defined as people over the age of 20 with Grd 7 as the highest level of education is sitting at 13.8%. The province with the highest adult literacy rate is the Eastern Cape (20.5%), closely followed by Limpopo (19.7%) and Northern Cape (19.1%).
Another worrying statistic for South Africa is the adult literacy rate, which is defined as people over the age of 20 with Grd 7 as the highest level of education is sitting at 13.8%. The province with the highest adult literacy rate is the Eastern Cape (20.5%), closely followed by Limpopo (19.7%) and Northern Cape (19.1%).
Number of registered students at higher education institutions (31 October 2017)
This section will take a look at the number of students registered at various higher education institutions across South Africa, at various points in time. Interesting to note is the increase of student numbers at specific institutions from 2012 to 2016 while there are strong declines at other institutions
When looking at the graphic above readers should note that the scale is logarithmic. Thus it increases 10 fold to the next value. So while it looks like North West university has student numbers not that far off from UNISA, UNISA has almost 5 times more students enrolled with them than the next biggest higher education institution which is North West university, closely followed by Tshwane University of Technology (TUT). However UNISA has seen its numbers decline by roughly 10% from 336 000 in 2016 to just under 300 000 in 2016. UNISA is not alone in this. University of Pretoria (TUKS), Vaal and University of Limpopo have seen similar declines in student numbers over the last 4 years.
On the opposite side there is University of Venda (Univen) which has shown incredible growth with numbers rising from just over 10 000 in 2012 to over 15 000 in 2016 (almost 50% increase in student numbers over a 4 year period). Central and WITS have also shown steady growth in student numbers over the period in question.
The image below shows the number of students graduating from the various higher education institutions over time. Encouraging to see is the fact that the numbers are increasing, but is this due to the increase in number of students or better pass rates being achieved?
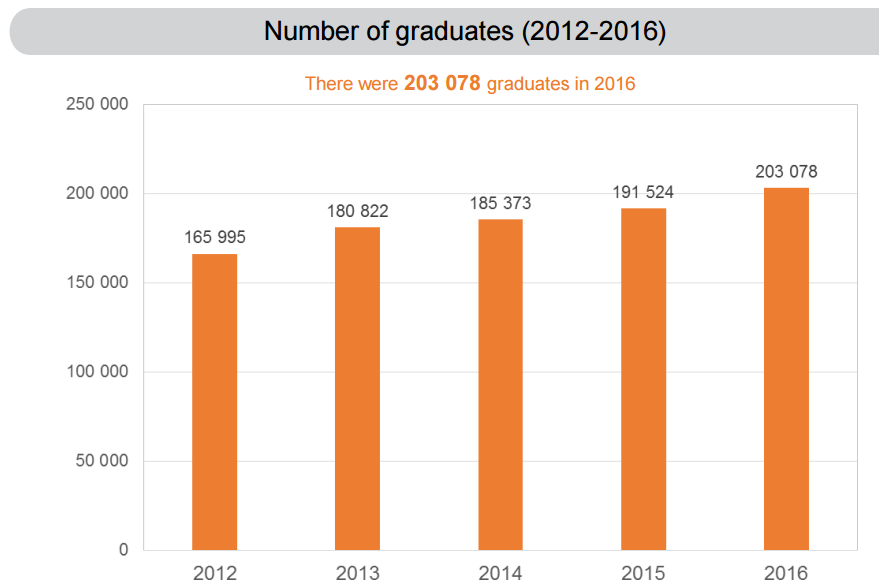
Image sourced from Statistics South Africa. www.statssa.gov.za
While the number of students enrolled has increased by 2.4% from 2012 to 2016, the number of students that graduated has increased by 22.3%. Clearly showing number of graduates increasing is not just due to the number of students increasing. The image below shows the total value of grants paid by national government to various higher education institutions. And it is clear to see that grants paid increased sharply after the #feesmustfall campaign. Interesting to note that the growth in grants paid is growing a lot faster for Universities compared to University of Technologies.
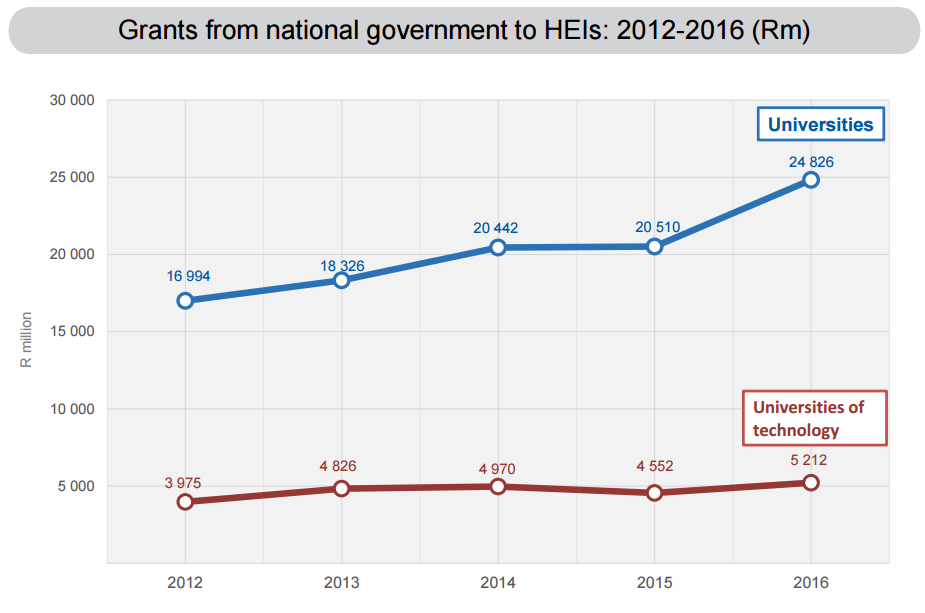
Grants paid by national government to higher education institutions. Source: Stats SA
While we mentioned earlier that University of Pretoria (TUKS) showed a decline in student numbers, the graphic below shows that it has not detered TUKS from spending money on upgrading their facilities and equipment (as their Capex spending accounts from over 10% of total capital expenditure by all higher education institutions. Surely this bodes well for the quality of education at TUKS, is there are less students yet better facilities and equipment. Stellenbosch University and WITS makes up the rest of the top three when it comes to capital expenditure by higher education institutions.
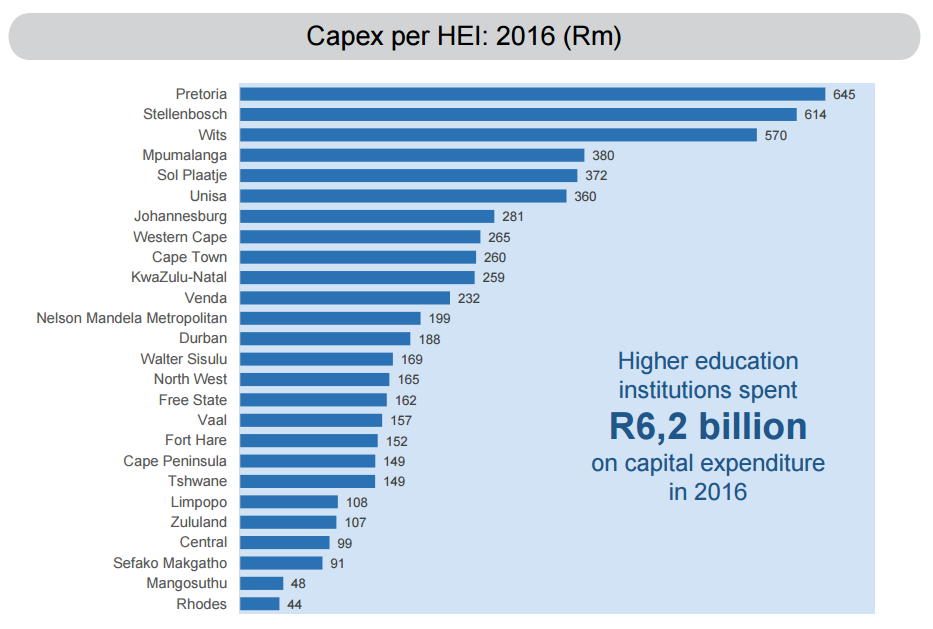
Capital expenditure (Capex) per higher institution in South Africa. Source : Statistics South Africa (www.statssa.gov.za)
The image below shows the percentage of students per race group that go on to obtain a bachelors degree after matriculating. And it is clear that white students as a percentage of the race group makes up the highest percentage of students who obtain a bachelors degree. Various factors contribute to this and we will touch on them below the image.
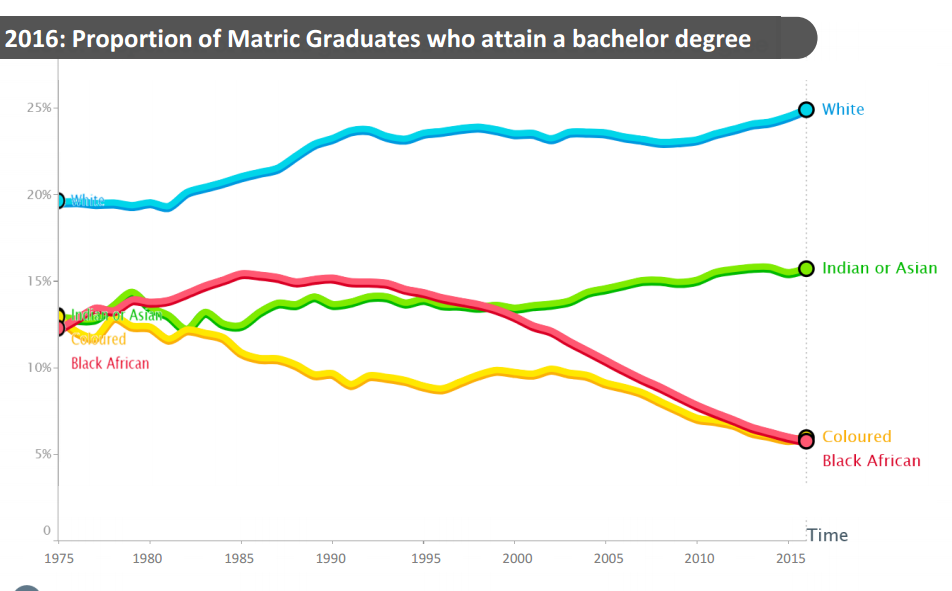
Percentage of students per race group that obtain a bachelors degree after matric. Source: Statistics South Africa
White students parents are more like to afford better primary and secondary schooling, and more likely to be able to pay for tertiary education, hence the higher percentage of white students obtaining bachelors degrees after matriculating With around 25% of white students obtaining a bachelors degree after matric, Indian/Asians comes a distant second with around 15% while both Coloured and Black Africans sitting around 5% of students obtaining a bachelors degree after matric. Concerning to see is the decline in the percentage of Coloured and Black African students obtaining bachelors degrees after school. Again part of this is due to a lack of funding from these race groups, making it harder for students from these groups to enter a higher education institutions. And this is part of the reason for the whole #feesmustfall campaign that swept across South Africa.
Number of learners per school grade (11 March 2016)
The funnel chart below is based on statistics from the Basic Education Department. It shows the number of learners registered per grade in South Africa. What is concerning to note that around 1,2 million learners are registered for Grade 1. Yet only 680 000 odd makes it to Grade 12.
Data from the Department of Higher Education showed the number of new graduates that registered at Higher Education Institutes (such as Varsities, Universities of Technologies etc.) coming in at 158 000 in 2013. Thus assuming all the new registrations were matriculants of the the previous year (which roughly totales 700 000) , only 22% of martriculants or about 1 in 5 makes it to Higher Education Institutions (HEI) after school. Looking at it a little differently, only 12% (or around 1 in 9) of school children entering grade 1 will make it to HEI if this trend continues.
This is a serious concern as the higher the level of education the greater the chance of being employed.
This is a serious concern as the higher the level of education the greater the chance of being employed.