|
Related Topics |
|
This page will be updated on an ad hoc basis with trade data from SARS. The page will look to provide users with interesting and useful information regarding South Africa's trade with the rest of the world. Currently the value of Imports and Exports per quarter equates to roughly 60% of South Africa's Gross Domestic Product (GDP). So trade is an extremely import part of the South African economy. The overall size of imports and exports as a percentage of our economy points to the fact that South Africa is a very open economy. A closed economy would be a country that does not trade a lot and manufacture or supply its local market with mostly domestically produced/manufactured goods. Due to South Africa's economy being so open, it does lend itself to greater volatility as the local economy is in a large part influenced by global events and economies.
While this page will for the most part contain interesting information and graphics regarding South Africa's trade with the rest of the world. It will also look at certain economic theories on trade and whether this holds true for South Africa or not. The image below provides a brief example of the type of information available on this page. 
Shipping yard
|
4 April 2020: South Africa's biggest trading partners for February 2020
South Africa's Revenue Service (SARS) released the latest trade statistics numbers and we take a look at South Africa's top 5 trading partners for both imports and exports as well as covering the value of our exports and imports for February 2020. How has the Coronavirus pandemic affected South Africa's trade with the rest to the world?
Exports:
Imports:
Total value of goods traded during February 2020:
So South Africa exported R14.151 billion more in goods than what it imported during February 2020. A bit of good news for South Africa's economy as one would rather have a positive trade balance than a trade deficit. One of South Africa's main imports (crude oil) has seen significant price declines following the oil price war between Russia and Saudi Arabia which has seen the oil price decline to levels last seen around 2003. And this certainly helps South Africa's trade balance. The question is whether South Africa can cash in on this purple patch in its trade with the rest of the world.
Exports:
- China (10.5%)
- Germany (9.8%)
- United States (7.5%)
- India (4.9%)
- Netherlands (4.6%)
Imports:
- China (17.9%)
- Germany (9.9%)
- United States (7.3%)
- India (5.4%)
- Saudi Arabia (5.3%)
Total value of goods traded during February 2020:
- Exports: R 109,603,214,329
- Imports:R 95,451,407,426
- Trade balance for February 2020: R 14,151,806,903
So South Africa exported R14.151 billion more in goods than what it imported during February 2020. A bit of good news for South Africa's economy as one would rather have a positive trade balance than a trade deficit. One of South Africa's main imports (crude oil) has seen significant price declines following the oil price war between Russia and Saudi Arabia which has seen the oil price decline to levels last seen around 2003. And this certainly helps South Africa's trade balance. The question is whether South Africa can cash in on this purple patch in its trade with the rest of the world.
10 February 2020: South Africa's biggest trading partners for December 2019
South Africa's Revenue Service (SARS) released the latest trade statistics numbers and we take a look at South Africa's top 5 trading partners for both imports and exports as well as covering the value of our exports and imports for December 2019. And December 2019 was a very good month for South Africa's trade balance with South Africa having a R14.8 billion positive trade balance with the rest of the world. Basically South Africa exported R14.8 billion more in goods than what it imported. Very good news for South Africa, however recent Rand weakness might see the cost of our imports rise substantially in coming months. The question one has to ask is what is impact that the Coronavirus will have on South Africa's trade with China, and a more general question how much will the Coronavirus affect trade of China with the world.
Exports:
Imports:
Total value of goods traded during November 2019:
And for those wondering why South Africa imports so much from Nigeria or wondering what exactly we are importing from Nigeria, the answer is oil. Nigeria is one of South Africa's biggest suppliers of crude oil, together with Saudi Arabia and Angola. And those wondering what South Africa exports to India to make India South Africa's 5th biggest trading partner for November 2019. The answer to that question is coal. South Africa has a large offset market for its coal reserves in India
Exports:
- China (11.0%)
- United States (7.5%)
- Germany (7.1%)
- United Kingdom (6.9%)
- India (5.2%)
Imports:
- China (11.0%)
- United States (7.5%)
- Germany (7.1%)
- United Kingdom (6.9%)
- India (5.2%)
Total value of goods traded during November 2019:
- Exports: R 103,312,962,305
- Imports: R 88,466,522,653
- Trade balance for December 2019: R 14,846,439,652
And for those wondering why South Africa imports so much from Nigeria or wondering what exactly we are importing from Nigeria, the answer is oil. Nigeria is one of South Africa's biggest suppliers of crude oil, together with Saudi Arabia and Angola. And those wondering what South Africa exports to India to make India South Africa's 5th biggest trading partner for November 2019. The answer to that question is coal. South Africa has a large offset market for its coal reserves in India
13 January 2020: South Africa's biggest trading partners for November 2019
South Africa's Revenue Service (SARS) released the latest trade statistics numbers and we take a look at South Africa's top 5 trading partners for both imports and exports as well as covering the value of our exports and imports for November 2019.
Exports:
Imports:
Total value of goods traded during November 2019:
And for those wondering why South Africa imports so much from Nigeria or wondering what exactly we are importing from Nigeria, the answer is oil. Nigeria is one of South Africa's biggest suppliers of crude oil, together with Saudi Arabia and Angola. And those wondering what South Africa exports to India to make India South Africa's 5th biggest trading partner for November 2019. The answer to that question is coal. South Africa has a large offset market for its coal reserves in India
Exports:
- China (10.1%)
- Germany (8.6%)
- United States (7.3%)
- United Kingdom (5.5%)
- India (5.1%)
Imports:
- China (19.2%)
- Germany (7.8%)
- United States (6.5%)
- India (5.5%)
- Nigeria (5.0%)
Total value of goods traded during November 2019:
- Exports: R 116,902,027,397
- Imports: R 110,804,693,420
- Trade balance for November 2019: R 6,097,333,977
And for those wondering why South Africa imports so much from Nigeria or wondering what exactly we are importing from Nigeria, the answer is oil. Nigeria is one of South Africa's biggest suppliers of crude oil, together with Saudi Arabia and Angola. And those wondering what South Africa exports to India to make India South Africa's 5th biggest trading partner for November 2019. The answer to that question is coal. South Africa has a large offset market for its coal reserves in India
12 September 2019: South Africa's biggest trading partners for July 2019
South Africa's Revenue Service (SARS) released the latest trade statistics numbers and we take a look at South Africa's top 5 trading partners for both imports and exports as well as covering the value of our exports and imports for July 2019.
Exports:
Imports:
Total value of goods traded during July 2019:
Exports:
- China (10.9%)
- Germany (7.4%)
- United Kingdom (6.2%)
- United States (6.0%)
- Japan (4.9%)
Imports:
- China (18.4%)
- Germany (10.5%)
- United States (7.0%)
- India (5.9%)
- Saudi Arabia (3.7%)
Total value of goods traded during July 2019:
- Exports: R 112,940,526,731
- Imports: R 115,821,345,757
- Trade balance for July 2019: - R 2,880,819,026
1 August 2019: South Africa's top trading partners for June 2019
South Africa's Revenue Service (SARS) released the latest trade statistics numbers and we take a look at South Africa's top 5 trading partners for both imports and exports as well as covering the value of our exports and imports for June 2019.
Exports:
Imports:
Total value of goods traded during June 2019:
Exports:
- China 11.3%
- Germany 7.0%
- United States 6.6%
- United Kingdom 5.2%
- India 4.8%
Imports:
- China 17.0%
- Germany 10.4%
- United States 6.0%
- Nigeria 5.9%
- Saudi Arabia 5.3%
Total value of goods traded during June 2019:
- Exports: R 108,173,850,578
- Imports: R 103,754,352,076
- Trade balance for June 2019: R 4,419,498,502
28 July 2019: International seaborne trade per region
The image below shows the percentage of loaded and unloaded seaborne trade per region for 2017. From this it is clear that the bulk of loaded and unloaded seaborne trade takes place in Asia. With 61% of unloaded goods (imports) happening in Asia while 42% of loaded goods (exports) takes place in Asia. The loaded seaborne trade in Asia is double that of the Americas. Oceania makes up 13% of loaded seaborne trade but only 1% of unloaded trade (largely Australia exporting raw commodities).
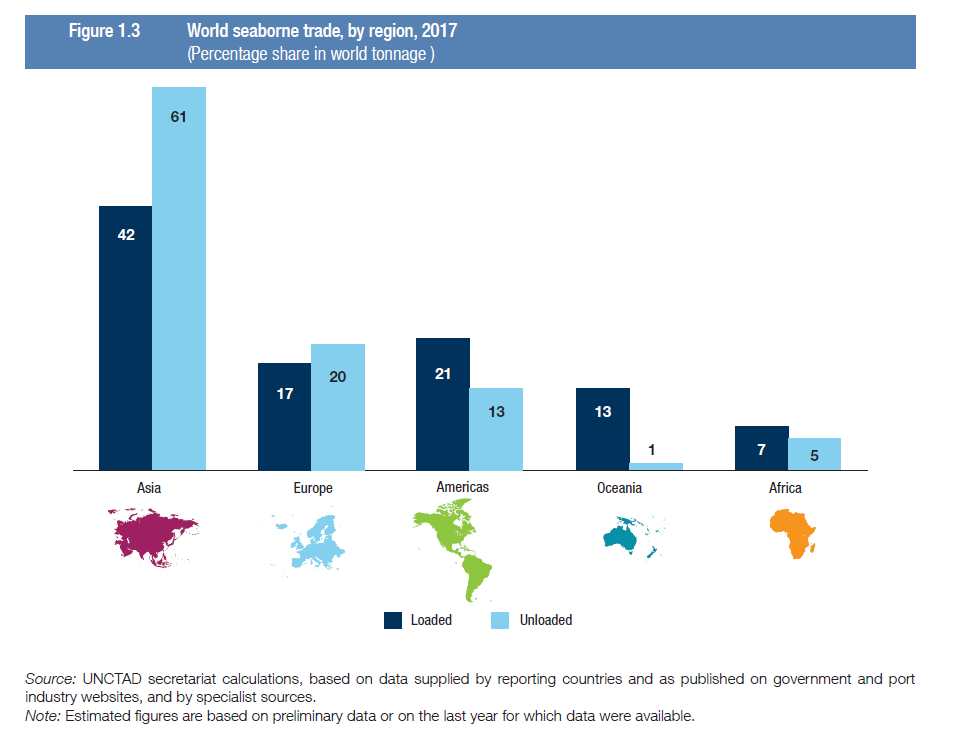
Europe has very close share to total share of loaded and unloaded seaborne trade with the area making up 17% of loaded trade (exports) and 20% of unloaded (imports) trade. Africa has a very even share between loaded and unloaded seaborne trade with it making up 7% of loaded trade and 5% of unloaded trade.
24 July 2019: International seaborne trade for selected years
We take a look at the latest international seaborne trade numbers for various time periods as obtained from the Maritime Shipping review published by the United Nations conference on trade and development (UNCTAD). Its shows the number of tons loaded on ships over various time periods.
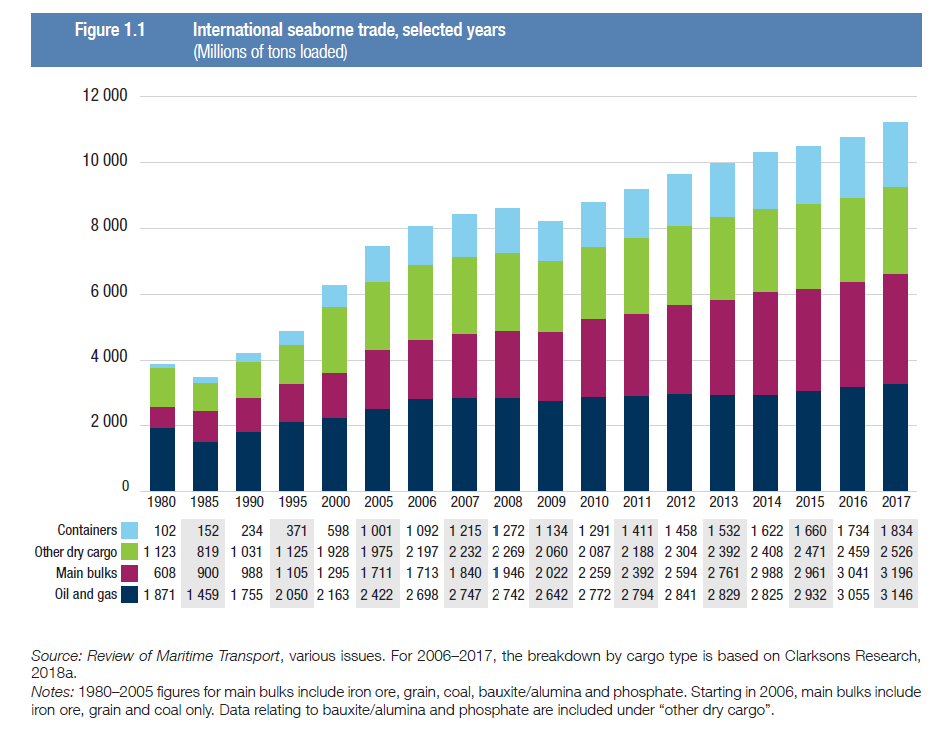
The bar chart shows just how significantly international trade via sea has increased since the 1980's to 2017. In 1980 less than 4000 million tons of goods were loaded on ships, and by 2017 this number increased to close to 12 000 million tons. One can also see the significant impact the global slowdown in 2008/2009 had on international trade during 2009, with the numbers loaded dipping significantly during 2019. Since then it has been a substantial upward trajectory in volumes of goods shipped. But one has to wonder what the numbers for 2018 and 2019 will look like, considering the trade war between the USA and China and now the USA and the EU.
4 July 2019: South Africa's coal exports largely heading to India
So South Africa exports a lot of coal. And we mean a lot of coal. Sure we use a lot of it via ESKOM, but we export substantial amounts. And the main buyer of South Africa’s coal exports? It is India.
From the May 2019 customs data released by South African Revenue Service (SARS) during May 2019, 66.8% of all of South Africa’s coal (in terms of Rand value) was exported to India. During May 2019 South Africa exported R6.005 billion in coal of which 66.8% or R4.012 billion was exported to India, while 10.3% or R620 million was exported to Pakistan during May 2019. So these two Asian countries alone accounted for close to 80% of South Africa’s coal exports during May 2019. The image below shows a treemap of South Africa's exports to India during May 2019
From the May 2019 customs data released by South African Revenue Service (SARS) during May 2019, 66.8% of all of South Africa’s coal (in terms of Rand value) was exported to India. During May 2019 South Africa exported R6.005 billion in coal of which 66.8% or R4.012 billion was exported to India, while 10.3% or R620 million was exported to Pakistan during May 2019. So these two Asian countries alone accounted for close to 80% of South Africa’s coal exports during May 2019. The image below shows a treemap of South Africa's exports to India during May 2019
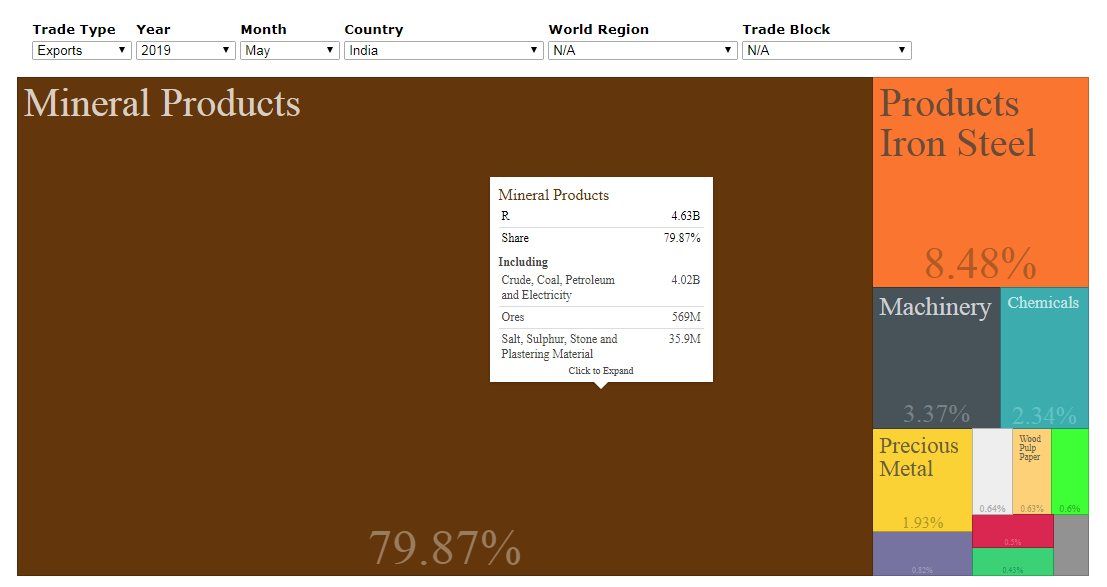
The treemap above shows that mineral projects (basically the coal exports to India) makes up 79.87% of South Africa's exports to India during May 2019. A distant second place was made up by products of iron and steel (this is largely Iron ore) being exported to India. From the above it is clear that the bulk of South Africa's exports to India are raw commodities and minerals. So not really a lot of manufactured goods being exported to India, it is mostly raw unprocessed goods.
3 July 2019: South Africa's trade balance in May 2019: R1.74 billion
In recent years South Africa has largely been running a "twin deficit", with the budget deficit of government (where government spends more than what they are getting in) as well as a trade deficit, where the value of South African exports is far less than the value of South Africa's imports, leading to a trade deficit. This "twin deficit" has definitely hurt the exchange rate over the years. Or it might be due to our weak exchange rate that we are running at a trade deficit. We have argued before a stronger Rand would mean one of our biggest imports (crude oil) would be a lot cheaper. And the effect of the cheaper oil would more than compensate for our exports becoming more expensive due to a stronger Rand, and thus a better trade balance due to a stronger Rand. It is contrarian and against regular economic theory and thought but we believe there is merit in this view.
South Africa recorded a positive trade balance of R1.7 billion during May 2019 with the rest of the world. The summary below shows the top 5 export destinations for South African exports during May 2019:
So just over 10% of South Africa's exports in May 2019 headed to China, with just over 7% heading to the United Sates.
The summary below shows the top 5 import origins in South Africa during May 2019:
Almost 20% of South Africa's imports came from China, 9.1% from Germany (most cars and machinery and equipment), and 7.3% of South Africa's imports came from the USA.
Total Exports for May 2019: R 112,069,153,495
Total Imports for May 2019: R 110,331,942,516
Trade Balance for May 2019: R 1,737,210,979
South Africa recorded a positive trade balance of R1.7 billion during May 2019 with the rest of the world. The summary below shows the top 5 export destinations for South African exports during May 2019:
- China (11.0%)
- United States (7.2%)
- Germany (6.8%)
- United Kingdom (6.1%)
- Japan (5.4%)
So just over 10% of South Africa's exports in May 2019 headed to China, with just over 7% heading to the United Sates.
The summary below shows the top 5 import origins in South Africa during May 2019:
- China (18.5%)
- Germany (9.1%)
- United States (7.3%)
- India (4.9%)
- Nigeria (4.6%)
Almost 20% of South Africa's imports came from China, 9.1% from Germany (most cars and machinery and equipment), and 7.3% of South Africa's imports came from the USA.
Total Exports for May 2019: R 112,069,153,495
Total Imports for May 2019: R 110,331,942,516
Trade Balance for May 2019: R 1,737,210,979
5 June 2019: South Africa's trade balance with the rest of the world
The story of South Africa's trade balance is a story of East vs West. On the one hand South Africa has a very positive trade balance with the West (in particular the USA). So the value of our exports heading to the United States is more than the value of the goods that we import from the United States. So the trade balance or terms of trade is net positive for South Africa. And the exact opposite is true when it comes to South Africa's trade balance with the East (in particular China). And this is not a uniquely South African phenomenon. Part of the reason for the trade war between the United States is China is due to the fact that terms of trade tends to be skewed in favour of China. The image below shows South Africa's terms of trade with the rest of the world for 2010 and for 2018. And as can be seen from the image below little to nothing has changed in South Africa's trade patterns over the last 8 years.
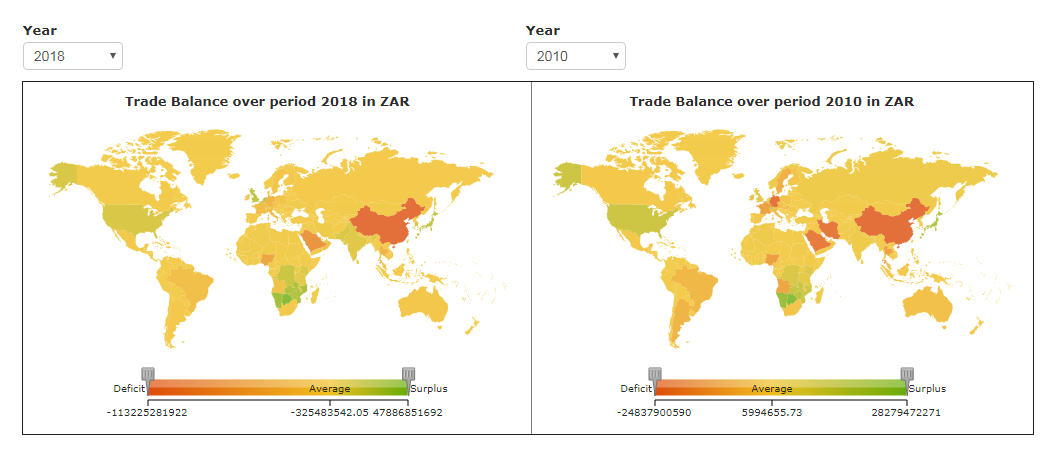
South Africa's trade balance with the rest of the world charted on a map
3 June 2019: April 2019 trade numbers for South Africa
For the month of April 2019, the following trade statistics were reported by the South African Revenue Service (SARS).
Breaking the numbers down the top 5 countries South Africa exported goods to were (percentage in brackets is percentage of total exports for April 2019):
And the top 5 countries South Africa imported goods from during April 2019 were (percentage in brackets is percentage of total imports for April 2019):
- Total Exports: R103.750 billion
- Total Imports: R107.177 billion
- Trade Balance: -R3.427 billion
Breaking the numbers down the top 5 countries South Africa exported goods to were (percentage in brackets is percentage of total exports for April 2019):
- China (10.8%)
- Germany (8.0%)
- United States (6.9%)
- United Kingdom (5.7%)
- India (5.6%)
And the top 5 countries South Africa imported goods from during April 2019 were (percentage in brackets is percentage of total imports for April 2019):
- China (17.8%)
- Germany (9.8%)
- United States (6.5%)
- Nigeria (6.2%)
- India (4.8%)
28 May 2019: Trade war between US and China affecting US firms significantly
So while the trade war between the USA and China has made headlines for more than a year, the effect of the increasing tariffs by the US in goods imported from China, and the retaliatory tariff increases implemented by China on goods imported into China from the USA has started affecting the companies in the USA that sell a lot of goods in China. According to research conducted by Bloomberg and calculations from the IMF, it shows how the stocks of companies in the USA with high sales in China has under performed US companies with high sales in other international markets other than China. See the image below.
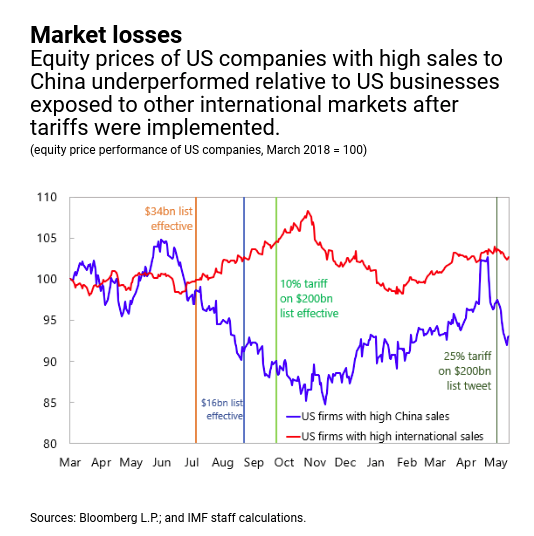
While this does not directly relate to South Africa's imports and exports or South African firms it illustrates the effect of tariff increases so should tariffs in SA exported goods ever be raised, one can assume it will have similar effects on locally listed firms which operate in countries where tariffs against South African goods are raised (if this were to happen of course).
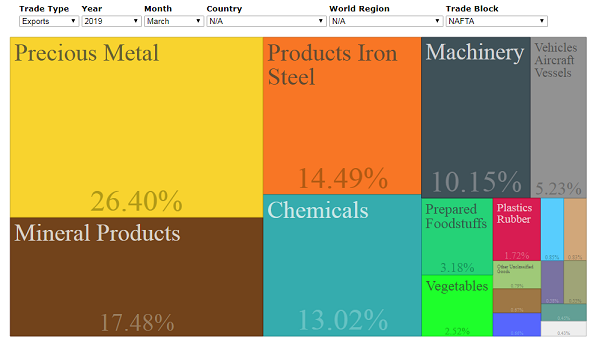
28 May 2019: SA trade with NAFTA countries for March 2019
In this update we focus on the stark differences in the goods being exported by South Africa to NAFTA countries (to those that don't know NAFTA countries are United States, Canada and Mexico). NAFTA was the acronym used for North American Free Trade Agreement). So what exactly are we exporting to this countries and conversly what are we importing from these countries? The treemaps below shows the percentage of total value that various product categories made up of exports from South Africa to NAFTA as well as South African imports from NAFTA.
Exports to NAFTA in March 2019
Imports from NAFTA in March 2019
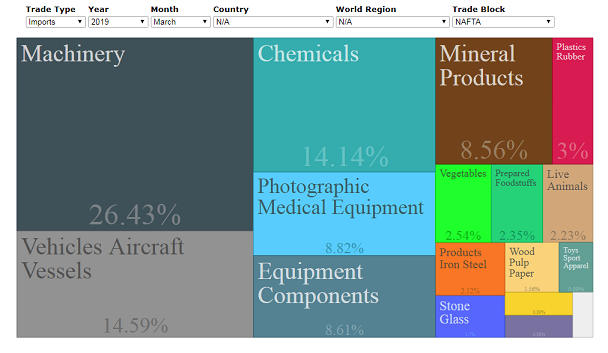
So from the two images above it is clear that South Africa exports far more basic commodities and goods to NAFTA than more complex final manufactured goods. And on the imports side South Africa imports far more final manufactured goods from NAFTA than what they import basic commodities or raw materials. This is part of the reason South Africa's manufacturing industry is not running at full capacity, as manufactured goods are being imported more frequently by South Africans, be it businesses or consumers.
Top 3 exports by South Africa to NAFTA during March 2019:
While global trade is good for increased product exposure and greater amount of choice and in the end cheaper prices due to the international market's competitive nature, it does have it draw backs, such as hurting the local manufacturing industry. But in saying that, if South Africa's economy was running at full steam, would ESKOM be able to supply enough power to keep the lights on in South Africa?
Top 3 exports by South Africa to NAFTA during March 2019:
- Precious metals
- Mineral products
- Products of iron and steel
- Machinery
- Vehicles, aircraft and vessels
- Chemicals
While global trade is good for increased product exposure and greater amount of choice and in the end cheaper prices due to the international market's competitive nature, it does have it draw backs, such as hurting the local manufacturing industry. But in saying that, if South Africa's economy was running at full steam, would ESKOM be able to supply enough power to keep the lights on in South Africa?
15 May 2019: Evolution of world's largest trade flows over time
While this update does not directly relate to South Africa's trade with the rest of the world, it does cover trade (exports and and imports) and how trade flows have changed over the last 20 years. The image below shows the largest trade flows in 1995 compared to that in 2015. And the obvious change is the massive trade flows heading into and out of China, as China requires commodities and raw materials to grow and it uses some of that in its manufacturing processes after which they then export goods to the rest of the world
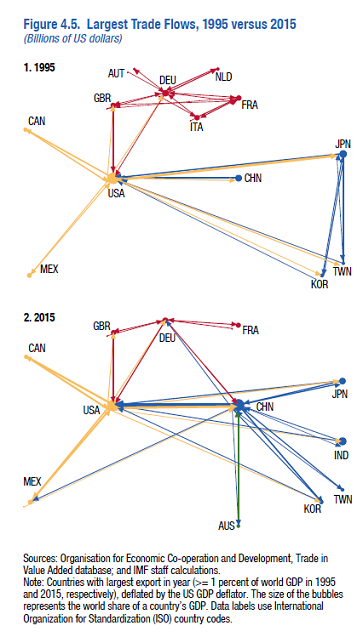
Large trade flows between Japan and Taiwan and Japan and South Korea in 1995 has now been replaced with large trade flows between Japan and China. Another key observation is the fact that in 1995 there were large trade flows between various European countries, And by 2015 there are far fewer trade flows seen as large trade flows between European countries. A country similar to South Africa in terms of geographical location (Southern Hemisphere) and product exports (largely commodities), Australia appears in 2015 large trade flows. This is as a result of Australia importing ever more from China while at the same time finding a massive market in China for their commodity exports
30 April 2019: South Africa's trade balance with world in March 2019: R5.004 billion
It is not often that South Africa has a positive trade balance with the rest of the world. In most months we tend to be net importers instead of net exporters. That is we tend to import more goods in terms of Rand value of imports than what we export. Part of the reason for this is the fact that we export less "essential" goods while some of our larger imports are "essential" goods for keeping the economy running. Crude oil for example. South Africa has no choice but to import crude oil as we dont have our own, and without it we will run out of fuel and the economy will grind to a halt. While on exports, countries can survive without importing gold, platinum, iron ore etc from South Africa. It is suprising then that the trade numbers for South Africa for March 2019 showed we exported R5 billion more in goods than what we imported. So who are our biggest trading partners currently?
Exports:
Imports:
Interesting observations from our side is the fact that India was one of our top 5 importing countries as we tend not to import a lot from India, while we tend to export large amounts of coal to India. And Japan as one of the Top 5 export destinations. It usually does not make the top 5 export destinations so would be curious to look at what exactly we exported to Japan during March 2019 and similarly what exactly we imported from India during March 2019.
In total we exported R105.41 billion of goods during March 2019 while we imported R100.4 billion during March 2019
Exports:
- China (10.8%)
- Germany (8.8%)
- India (5.7%)
- United States (5.7%)
- Japan (4.6%)
Imports:
- China (14.2%)
- Germany (12.1%)
- United States (7.0%)
- Saudi Arabia (5.9%)
- India (4.5%)
Interesting observations from our side is the fact that India was one of our top 5 importing countries as we tend not to import a lot from India, while we tend to export large amounts of coal to India. And Japan as one of the Top 5 export destinations. It usually does not make the top 5 export destinations so would be curious to look at what exactly we exported to Japan during March 2019 and similarly what exactly we imported from India during March 2019.
In total we exported R105.41 billion of goods during March 2019 while we imported R100.4 billion during March 2019
1 March 2019: January 2018 SA trade balance with world: -R13.08 billion
Before looking at South Africa's trade deficit for January 2019 we want to touch on the trade war between the USA and China as this relates to South Africa's trade balance in January 2019. Part of President Trump's issue with China is the fact that the trade balance between the two countries are largely skewed in favour of China. Basically China is the main beneficiary of trade between the two countries. China exports a whole lot more to the United States than what they are buying from the USA. And in an effort to reverse this skewed trade balance the trade war started with tariffs being imposed in the USA on a large variety of goods being imported from China. To essentially make Chinese imports more expensive and force Americans to either produce it themselves or find alternative trading partners other than China to buy these goods from. But as the USA raises tariffs, China retaliates with imposing tariffs on US goods such as vehicles, iPhones etc. All this does is push up the cost of goods being imported and exported. But the USA is a far larger economy than China and the trade tariffs tit for tat will eventually start hurting China, which is far more dependent on US buying their goods than what the US is on cheap Chinese imports.
This trade balance skewness where China exports more than what they import has been the main driver of Chinese growth over the last 2 odd decades. But it is unfair and due to China's economic power now it seems they are taking advantage of their economic size and are continuing with the trade system in which they tend to be net exporters rather than net importers of goods. And this brings us to South Africa's trade deficit of -R13.08 billion for January 2019. In January 2019 South Africa's imports and exports looked as follows:
Now lets look at South Africa's Top 5 import origins and Top 5 exports destinations:
Imports:
And the real shocker is the fact that the department of economic development and department of trade and industry does not seem fussed about it at all. We have not heard a peep from these departments about potentially relooking trade deals with China. Partly because we do not have the economic muscle to get into a trade war with China, and partly because there is a lack of political will to address this. Instead China is allowed to buy up minerals and companies in South Africa as they please it seems.
This trade balance skewness where China exports more than what they import has been the main driver of Chinese growth over the last 2 odd decades. But it is unfair and due to China's economic power now it seems they are taking advantage of their economic size and are continuing with the trade system in which they tend to be net exporters rather than net importers of goods. And this brings us to South Africa's trade deficit of -R13.08 billion for January 2019. In January 2019 South Africa's imports and exports looked as follows:
- Exports: R88.68 billion
- Imports: R101.76 billion:
- Trade deficit: R13.08 billion
Now lets look at South Africa's Top 5 import origins and Top 5 exports destinations:
Imports:
- China 23.1%
- Germany 9.2%
- United States 5.7%
- India 4.2%
- Saudi Arabia 3.4%
- China 11.1%
- United States 8.1%
- Germany 6.2%
- Japan 4.8%
- Botswana 4.8%
And the real shocker is the fact that the department of economic development and department of trade and industry does not seem fussed about it at all. We have not heard a peep from these departments about potentially relooking trade deals with China. Partly because we do not have the economic muscle to get into a trade war with China, and partly because there is a lack of political will to address this. Instead China is allowed to buy up minerals and companies in South Africa as they please it seems.
6 November 2018: South Africa's exports, imports and trade balance with rest of the world
In today's update we take a look at the monthly value of South Africa's reported exports, its imports as well as South Africa's monthly trade balance (Exports - Imports) with the rest of the world. On the graph representing South Africa's trade balance with the rest of the world, green shows a positive trade balance, I.e we as South Africa exported more in Rand value of goods than what we imported. And the red represents a negative trade balance, I.e South Africa imported more goods in Rand value than what we exported.
Readers will notice that South Africa's trade balance tends to move between a positive trade balance and a negative trade balance. So South Africa is not really a net exporter nor a net importer of goods. Ideally South Africa would like to be a net exporter as this would have positive implications in South Africa's economic growth.
Sadly as we showed yesterday South Africa's manufacturing industry is only running at 81% of full production capacity, as South Africa tends to import manufactured goods instead of manufacturing it locally, or instead of businesses using locally manufactured goods. If local businesses bought more from local manufacturers, less will be imported by South Africa and this could lead to South Africa becoming a net exporter of goods, while at the same time local industries are supported. Government policies needs to promote the support and buying from local firms, in order to protect industries such as South Africa's manufacturing industry, without imposing tariffs on imports which could lead to retaliatory tariffs on our exports.
Sadly as we showed yesterday South Africa's manufacturing industry is only running at 81% of full production capacity, as South Africa tends to import manufactured goods instead of manufacturing it locally, or instead of businesses using locally manufactured goods. If local businesses bought more from local manufacturers, less will be imported by South Africa and this could lead to South Africa becoming a net exporter of goods, while at the same time local industries are supported. Government policies needs to promote the support and buying from local firms, in order to protect industries such as South Africa's manufacturing industry, without imposing tariffs on imports which could lead to retaliatory tariffs on our exports.
1 March 2018: SA's trade balance with the rest of the world
In today's update we take a look at South Africa's trade balance with the rest of the world from January 2010 to January 2018. And while the graphic on a month to month basis looks extremely volatile and doesn't say much, with some moving average smoothing we can clearly identify the underlying trend in the data, and its this trend that we are after. And we will compare the underlying trend in the trade balance of South Africa with the exchange rate of South Africa and look at whether these two move in opposite directions as economic theory suggests. The theory suggests that as a country's exchange rate gets weaker, it will import less and export more and this should lead to improved trade balances, and visa versa, if the exchange rate strengthens, a country will import more goods and their exports will fall as the price of the country's exports become more expensive due to the stronger exchange rate. The graphic below shows South Africa's trade balance with the rest of the world per month.
Encouraging to see for South African's is the strong improvement in the trade balance during the year of 2017. In 2017 South Africa had a trade surplus with the rest of the world of R79.9billion. While it does sound like a lot of money, the sad reality is that over the period 2012 to 2015 South Africa had massive trade deficits and the cumulative effect of this will take a long time to be wiped out. The table below shows South Africa's trade balance with the rest of the world on a yearly basis.
Year |
Trade Balance |
2010 |
R 60 133 558 002 |
2011 |
R 43 686 714 191 |
2012 |
-R 38 000 753 176 |
2013 |
-R 69 197 106 655 |
2014 |
-R 82 728 607 558 |
2015 |
-R 52 253 842 509 |
2016 |
R 1 040 041 313 |
2017 |
R 79 928 864 834 |
2018 |
R -27 662 610 526 |
So from January 2010 to January 2018, South Africa has a cumulative trade balance of -R85,05billion with the rest of the world. This is despite the strong trade surplus shown by South Africa during 2017. One of the main reasons that South Africa's trade balance improved during 2016 and 2017 is the fact that oil prices have been depressed and South Africa has used less crude oil, which is one of South Africa's main imports. This has gone a long way in ensuring South Africa's imports are less than their recorded exports.
The graphic below takes a look at the smoothed out trade balance (a moving average of 13 was applied to the trade balance data in order to identify the underlying trade in the trade balance data) and compares it to the South African Rand and we find that the trade balance of South Africa is not behaving as economic theory would suggest. A weaker exchange rate does not translate into an improving trade balance and a stronger exchange rate does not necessarily lead to a poorer trade balance.
So why is this? Well South Africa imports goods for which demand is relatively inelastic. I.e. we will import it regardless of price, as we need the goods. Think of oil, machinery and equipment and cars for example. So when the currency is stronger, these goods become cheaper that we import, aiding our trade balance as we not paying as much for the goods we are importing, and while we might lose out on exports due to our export prices being more expensive, the savings we get from importing goods with the stronger exchange rate more than offsets the lost money due to exports being more expensive.
27 October 2017: South Africa's crude oil imports
The following pie chart shows the top 10 contributing countries to South Africa's crude oil imports from January 2010 to June 2017. Saudi Arabia is by far South Africa's biggest supplier of crude oils. Followed closely by Nigeria and Angola coming in a distant 3rd.
The table below shows the average Rand value (as well as kilograms) of crude oil imported into South Africa on a monthly basis per year. And the amount of crude oil imported into South Africa has been declining steadily since 2015. There might be various possible reasons for this. We discuss possible reasons for this below the table.
Year |
Value (Rand) |
Quantity (kg) |
2010 |
184.7mil |
43.6mil |
2011 |
241.4mil |
42mil |
2012 |
310mil |
45.5mil |
2013 |
372.8mil |
48.9mil |
2014 |
407.9mil |
49.4mil |
2015 |
271.2mil |
54.2mil |
2016 |
193.3mil |
41.9mil |
2017 |
212.6mil |
41.3mil |
The declining imports of crude oil could point to a few things.
1. Cars are becoming more fuel efficient thus less crude oil required to produce petrol as less petrol is being used
2. More car pooling and greater use of public transport by South Africans
3. Struggling consumers are more conscious about their driving habits and drive less often in order to save on petrol.
We suspect it a combination of all 3 of these elements. And with electric cars gaining more traction we suspect that this declining trend in volume of crude oil imports in South Africa will continue.
SA's customs offices: Where is imports and exports processed?
In today's summary of of South Africa's trade we take a look at the various customs office across the country and check where the goods are processed. While certain transactions are processed at offices other than the point of entry or exit of the goods, the overall numbers still provides a very good idea of where exactly goods leaving the country leaves the country from, and where goods entering South Africa is actually entering South Africa from. The long bar chart below shows the total value of imports and exports per customs office from January 2010 to June 2016.
The only glaringly obvious record is imports processed at Durban Harbour. Goods worth R3.3trillion entered South Africa's borders via the port in Durban. That equates to roughly 47.2% of the value of all goods imported into South Africa from January 2010 to June 2017 entered South Africa via Durban harbour. While around 13% of South Africa's exports (in terms of value) leaves South Africa via Durban harbour.
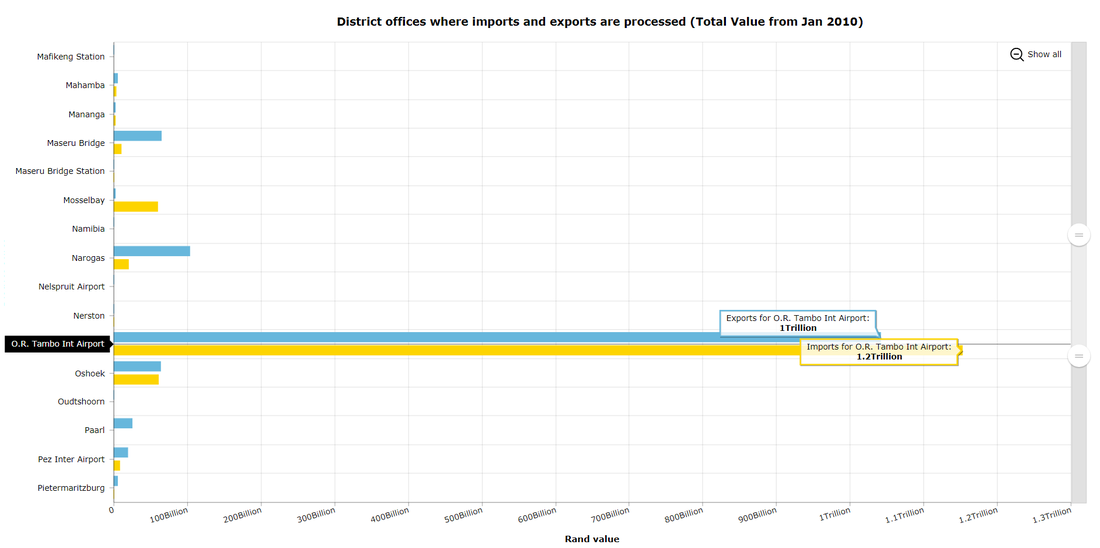
Value of SA's imports and exports leaving South Africa via OR Tambo International Airport
The zoomed in image of the graphic above shows the total value of goods leaving and entering South Africa via South Africa's biggest and busiest airport, OR Tambo international airport. 15% of South Africa's exports (in terms of value) left the country via OR Tambo and roughly 16.4% of South Africa's imports (by value) by value entered the country (based on total imports and export values from January 2010 to June 2016).
30 August 2017: SA's trade with SACU members
Southern African Customs Union (SACU), is the oldest customs union in the world, and consists of South Africa, Botswana, Lesotho, Namibia and Swaziland. In the update today we will take a look at trade of SACU members with South Africa. I.e what is the value of goods imported from or exported too Botswana, Lesotho, Namibia and Swaziland.
The pictures below is based on our graphic released on the 21 August 2017 (on this page), which contains SA's trade with most countries in the world, over time (from 2010 up to middle 2017).
So just how big is trade between South Africa and its SACU members? Exports to SACU members makes up roughly 12% of SA's total exports, while imports from SACU countries makes up around 3% of SA's total imports.
Imports from SACU
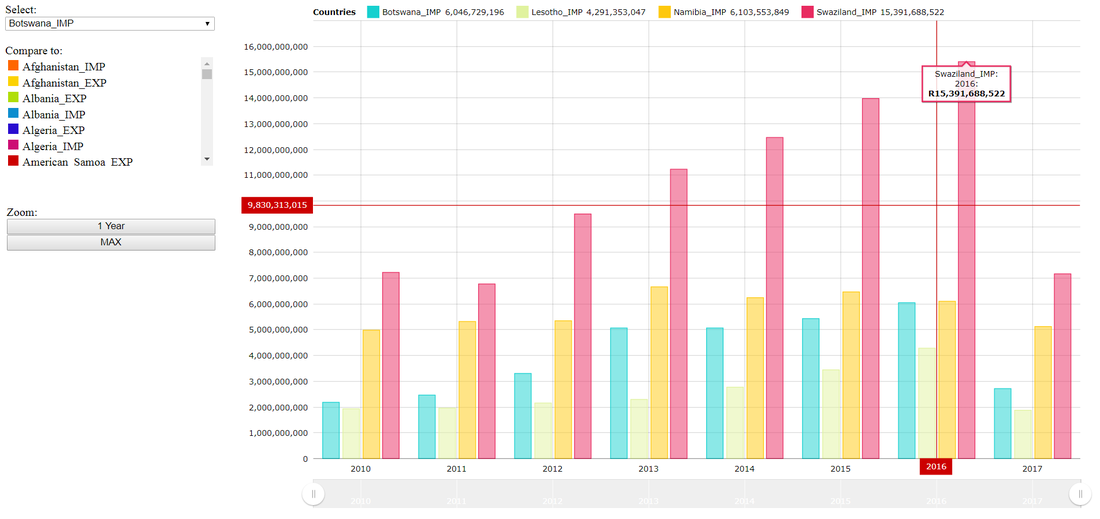
South African imports from SACU member states over time
As can be seen from the picture above, of the SACU countries, SA imports the most from Swaziland, with Namibia coming a distant second place, While imports from Botswana and Lesotho is very small. Note that over the time period the most imported from a SACU member counry was R15.4billion. We will compare this value to exports to SACU members below.
Exports to SACU
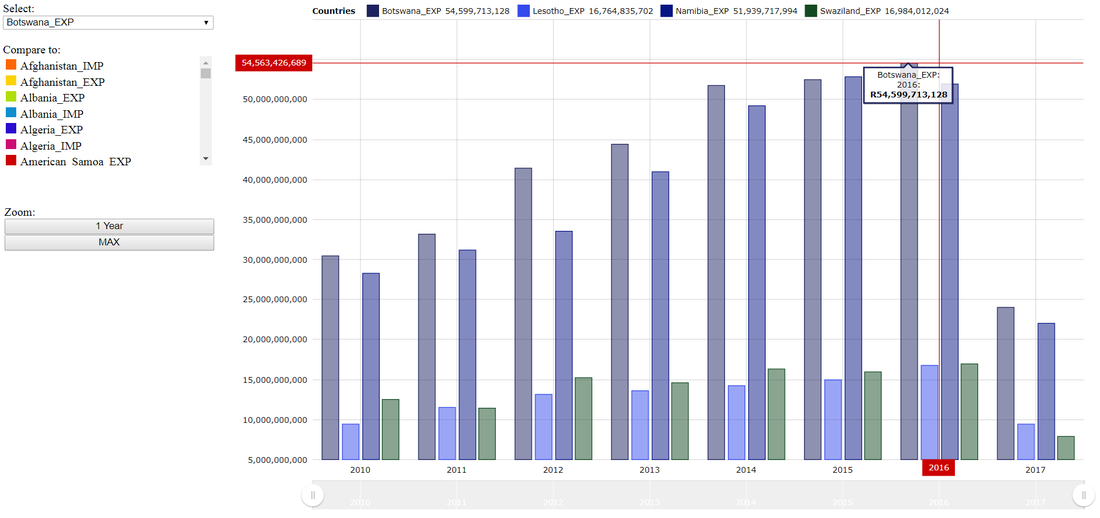
South African exports to SACU member states
As can be seen from the image above, the value of exports to SACU members is far greater than the value if imports from SACU members. Exports to Botswana and Namibia dominates the graphic, as exports to Lesotho and Swaziland is very small compared to the the values of Botswana and Namibia.
21 August 2017: SA's trade with the world. All in one graphic
In probably our most ambitious interactive graphic yet, we have decided to add all Imports and Exports into South Africa and from South Africa from 2010 into one single graphic. Users can decide whether they want to look at a specific country's trade with South Africa (I.e that country's imports into South Africa and South Africa's exports to that country). Or readers can compare the exports of South Africa to various different countries, or the imports of South Africa from various countries. EXP at the end of each country signals South African exports to this country, while IMP signals South African imports from the specific country.
Users can use the scroll bar at the bottom to define the date range they want to look at, or select MAX to see the bar chart for each year from 2010 up to latest available data for 2017.
Users can use the scroll bar at the bottom to define the date range they want to look at, or select MAX to see the bar chart for each year from 2010 up to latest available data for 2017.
Some of South Africa's biggest trading partners include:
China
United States of America
Germany
Japan
France
Botswana (especially on the Exports side)
Namibia (especially on the Exports side)
But we would suggest readers explore the graphic as much as they want and look at trade with some of the smaller countries and islands as well.
A few of our recommendations for comparisons would include:
- China Imports vs China Exports (This just shows how skew our trade with China is as we import way more from China than what we export to them)
- China Exports vs United States Exports
- Germany Imports vs Germany Exports
- Germany Imports vs UK Imports vs France Imports vs Italy Imports (All four are big EU trading partners of South Africa and South Africa imports vehicles from all of these countries And vehicles is one of SA's single biggest imports each month).
- Botswana Exports vs Namibia Exports (two largest trading partners of South Africa in the Southern African Customs Union (SACU)
- Australia Imports vs Argentina Imports vs New Zealand Imports (Since its the Rugby Championship)
8 August 2017: South Africa's trade with reclusive North Korea
Below we take a look at the value of trade (both imports and exports) between South Africa and North Korea. Surprised that South Africa actually trades with North Korea? So were we. Below the value of trade between the two countries as reported by South African Revenue Service (SARS)
There is a clear stand out year, and this is a year in which North Korea imported a lot of mineral products from South Africa in 2010 and 2011. Other than that trade has been rather subdued between the two countries. But none the less there has been trade between the two countries. So for those who asked us if South Africa trades with North Korea, yes they do. And below shows a product breakdown of all trade between the two countries.
From the product breakdown it is clear again that mineral products dominated the trade in terms of South Africa's exports to North Korea. Question is why would South Africa be importing products of Iron and Steel or Machinery from North Korea? Was there no other more trade friendly country businesses in South Africa could obtain these items from?
Does a weaker Rand boost our exports?
The first thing we would like to tackle with regards to international trade is the myth/theory that a weaker exchange rate leads to greater exports and lower imports (and therefore improved trade balances). The economic theory behind this is as follows. As the exchange rate of Country A weakens, goods being imported into Country A becomes more expensive, and goods being exported from Country A, becomes cheaper for Country B to import from Country A. While the theory is sound (and may apply to some countries), this is certainly not the case for South Africa.
The graphic below shows South Africa's trade balance per month from the beginning of 2010. A surplus (green in the graph) is when South Africa's exports were more than its imports, and a deficit (red in the graph) when South Africa's imports were more than its exports. The graphic also shows the Rand/Dollar exchange rate (light blue in graph) per month for the same period. The Dollar is used as a benchmark as most of the world's trade takes place in US Dollars.
Its clear from the graphic below that a weaker exchange rate does not lead to increases in South Africa's trade balance. In fact the reverse is true. As South Africa's exchange rate gets worse, the trade balance is getting worse too. Now there are numerous possible explanations for why this is case. We will take a look at a few below the graphic.
Trade balance data obtained from SARS, the exchange rate data obtained from the South African Reserve Bank (SARB)
So the question is, why does economic theory regarding a weakening exchange rate's impact on trade balances not hold true for South Africa?
So is government and the South African Reserve Bank (SARB) aware of this? Do they realise that economic theory hammered into economics and business students does not necessarily hold true for South Africa? Should we not try and set policies that will ensure a stronger currency? (We are playing devils advocate with this question. But someone has to ask it).
Making our imports of essential items such as crude oil cheaper via a stronger exchange rate, could more than offset our exports becoming more expensive, leading to a smaller deficit or even a positive trade balance. We can't really say if this will be the case, as we need to know where South Africa's equilibrium exchange rate is, and what impact having a 10% stronger or weaker than equilibrium exchange rate has on our trade balances and the economy in general. In coming weeks we will do work on looking to find South Africa's equilibrium exchange rate. A research page will be created for this.
All we know is we need to address the trade deficit which has since January 2010 to January 2016, ballooned to just over R150 billion. Essentially we spent R150 billion more on buying goods from the rest of the world, than what we received for selling goods to the rest of the world since January 2010.
Put different, that R150 billion amounts to basically 2 months in which we just imported goods and exported absolutely nothing. At the same time the Rand has depreciated from around R7.45 to the US dollar to over R16 a dollar by January 2016. So clearly a weaker exchange rate DOES NOT boost South African export earnings.
There is a 0.42* positive correlation between a weakening exchange rate and increasing trade deficit, and this when economic theory/hypothesis expects a strong negative correlation between the two variables. *Correlations are measured between -1 and 1, with -1 being a very strong negative correlation and 1 being a very strong positive correlation. Correlation values close to 0 implies no correlation between two variables.
South African policy makers needs to look at these kinds of issues in more detail and more proactively. In an ever evolving world, does economic theory and thoughts that were developed decades ago still hold true? If not, we better evolve and adjust our policies accordingly
- Demand for South African exported goods (mostly commodities such as coal and platinum) are not completely inelastic. Demand has dropped off in recent years and combined with this there has been less capital inflows from foreigners into SA. In fact there has been large scale capital outflows in recent months, putting immense pressure on the exchange rate. Companies are no longer expanding or investing in South African businesses (in particular our mines). This is largely due to lack luster returns earned on commodities over the last two years. Less investment in a country leads to less demand for that country's currency and therefore a weaker exchange rate.
- Demand for imported goods are more inelastic than the demand for our exported goods. South African manufacturers/consumers still require and consume foreign made goods (even though the Rand price of importing such items are increasing the demand for these are not falling due to increasing prices). Thus demand is inelastic as its not affected a lot by price increases.
- To put the above differently, we are exporting non-essential goods (I.e country's can survive without some of our larger exports (coal, iron ore, platinum etc.)), while we cannot survive without the goods we are importing. Think about this, South Africa exporting platinum vs South Africa importing Crude oil. At any given point a country can survive without importing platinum from South Africa, can South Africa survive by not importing Crude oil from Nigeria, Angola, Saudi Arabia etc? Not likely.
So is government and the South African Reserve Bank (SARB) aware of this? Do they realise that economic theory hammered into economics and business students does not necessarily hold true for South Africa? Should we not try and set policies that will ensure a stronger currency? (We are playing devils advocate with this question. But someone has to ask it).
Making our imports of essential items such as crude oil cheaper via a stronger exchange rate, could more than offset our exports becoming more expensive, leading to a smaller deficit or even a positive trade balance. We can't really say if this will be the case, as we need to know where South Africa's equilibrium exchange rate is, and what impact having a 10% stronger or weaker than equilibrium exchange rate has on our trade balances and the economy in general. In coming weeks we will do work on looking to find South Africa's equilibrium exchange rate. A research page will be created for this.
All we know is we need to address the trade deficit which has since January 2010 to January 2016, ballooned to just over R150 billion. Essentially we spent R150 billion more on buying goods from the rest of the world, than what we received for selling goods to the rest of the world since January 2010.
Put different, that R150 billion amounts to basically 2 months in which we just imported goods and exported absolutely nothing. At the same time the Rand has depreciated from around R7.45 to the US dollar to over R16 a dollar by January 2016. So clearly a weaker exchange rate DOES NOT boost South African export earnings.
There is a 0.42* positive correlation between a weakening exchange rate and increasing trade deficit, and this when economic theory/hypothesis expects a strong negative correlation between the two variables. *Correlations are measured between -1 and 1, with -1 being a very strong negative correlation and 1 being a very strong positive correlation. Correlation values close to 0 implies no correlation between two variables.
South African policy makers needs to look at these kinds of issues in more detail and more proactively. In an ever evolving world, does economic theory and thoughts that were developed decades ago still hold true? If not, we better evolve and adjust our policies accordingly
So what is South Africa's Biggest Import and Export Commodities?
For the answer to this question, see our Blog post on South Africa's 10 biggest imports and exports.