South African Market Insights
  • Home
  • Blog
    • Blog-5Jun2018
    • Blog-18May2018
    • Blog-16May2018
    • Blog-3May2018
    • Blog-2May2018
    • Blog-30Apr2018
    • Blog-26Apr2018
    • Blog-24Apr2018
    • Blog-18Apr2018
    • Blog-17Apr2018
    • Blog-16Apr2018
    • Blog-3Apr2018
    • Blog-22Mar2018
    • Blog-20Mar2018
    • Blog-19Mar2018
    • Blog-23Oct2017
    • Blog-20Oct2017
    • Blog-11Oct2017
    • Blog-10Oct2017
    • Blog-6Oct2017
    • Blog-3Oct2017
    • Blog-2Oct2017
  • Economics
    • Rand Dollar Exchange Rate
    • South Africa's GDP
    • South Africa's Unemployment
    • SA by numbers
    • Economic Progress Index
    • Taylors Rule
    • South Africa's Formal Business Sector
    • South-Africa's-Fiscal-Policy
    • SA EU Trade Data
    • Inflation Heat Map
    • Population Density Map
    • Labour Market Dynamics
    • Estimating the Size of the Informal Economy
    • SA Consumer Spending Patterns
    • South Africa's Monetary Fiscal Policy Mix
    • GDP Animations >
      • SouthAfrica
      • WesternCape
      • EasternCape
      • NorthernCape
      • FreeState
      • KwaZuluNatal
      • NorthWest
      • Gauteng
      • Mpumalanga
      • Limpopo
    • South Africa's Economic Structure
    • South Africa's Economic History
    • South Africa's Trade Data Page
    • South Africa's Food and Beverages Sector
    • Financial Well-being of South African Companies_2015
    • SA vs the World
    • Budget Day Page (24 Feb 2016)
  • Stock in Focus
    • JSE ALSI Chart
    • Sector Comparison Page
    • JSE-Calendar-Tracker-2019
    • Adcorp (ADR)
    • Amazon (AMZN)
    • Apple (AAPL)
    • Ascendis (ASC)
    • AVI (AVI)
    • Bidvest (BVT)
    • Blue Label Telecoms (BLU)
    • Bowler Metcalf (BCF)
    • Capitec (CPI)
    • City Lodge Hotel Group
    • Clicks Group (CLS)
    • Coronation (CML)
    • Curro Holdings (COH)
    • Discovery (DSY)
    • Distell (DST)
    • EOH (EOH)
    • Famous Brands (FBR)
    • Ferrari (RACE)
    • FirstRand Group (FSR)
    • Grindrod (GND)
    • GrowthPoint (GRT)
    • Holdsport (HSP)
    • Harley-Davidson (HOG)
    • Hyprop (HYP)
    • Hyprop (HYP)_1Jun2016
    • Investec Property Fund (IPF)
    • JSE (JSE)
    • Massmart (MSM)
    • MediClinic (MEI)
    • MTN (MTN)
    • MTN (MTN)_May2016
    • Mr Price Group (MRP)
    • Mr Price Group (MRP)_8APR2016
    • Nedbank (NED)
    • OneLogix (OLG)
    • Peregrine Holdings (PGR)
    • Pick 'n Pay Stores (PIK)
    • Pioneer Foods (PFG)
    • PSG Group (PSG)
    • Quantum Foods (QFH)
    • RCL Foods (RCL)
    • Remgro (REM)
    • Richemont (CFR)
    • RMB Holdings (RMH)
    • Rolfes (RLF)
    • Sanlam (SLM)
    • Sasol (SOL)
    • Sasol (SOL)_18sep2016
    • Santova (SNV)
    • Spar Group (SPP)
    • Shoprite Holdings (SHP)
    • Spur Corporation (SUR)_7Sep2017
    • Standard Bank (SBK)
    • Steinhoff International Holdings (SNH)
    • Stor-Age (SSS)
    • Super Group (SPG)
    • Taste Holdings (TAS)_30May2016
    • The Foshini Group (TFG)
    • Value Logistics (VLE)
    • Vodacom (VOD)
    • Wilson Bayly Holmes Ovcon (WBO)
    • Woolworths (WHL)
    • Woolworths (WHL)_24Aug2017
    • Zeder (ZED)
  • Online Calculators
    • Rand Petrol Price Estimator
    • Share Valuation
    • Financial Ratios Calculator
    • GDP Growth Estimator
    • Future Value of Investment Calculator
    • Loan repayment calculator
  • Contact
  • About
  • Search

< What the Big Mac index says about the value of the rand
Monetary Fiscal Policy Mix >

South Africa's crude oil imports. Where is it coming from?

Category: International trade and crude oil
Date
: 23 October 2017 

Related Topics

In today's blog we take a detailed look at South Africa's crude oil imports from January 2010 to June 2017. Where exactly is South Africa's crude oil imports coming from? Where does it enter South Africa's borders and what is the price paid per kilogram of crude oil per country South Africa imports crude oil from?
Picture
  • South Africa's Trade Data Page

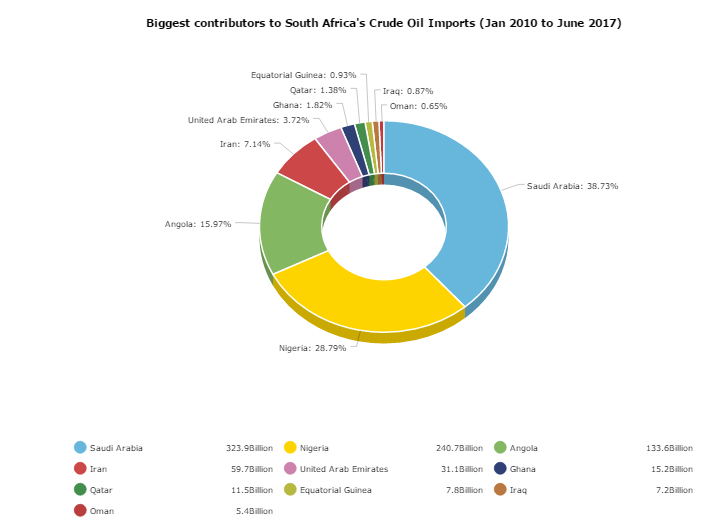
The ten biggest contributors to South Africa's crude oil imports

The pie chart below shows the 10 biggest contributors to South Africa's crude oil imports. Almost 40% of South Africa's crude oil imports comes from Saudi Arabia. Nigeria is the 2nd biggest contributor to South Africa's crude oil imports, with almost 30% of all of South Africa's crude oil imports coming from Nigeria. In a distant 3rd place is Angola, with almost 16% of South Africa's crude oil coming from Angola. Surprising to see is Iran is South Africa's 4th biggest contributor to crude oil imports (and this with Iran having sanctions imposed on them over very long periods of time from January 2010 to June 2017). One wonders how much bigger Iran's crude oil imports into South Africa would have been if it was not for sanctions imposed against them.
chart created with amCharts | amCharts
The second pie chart we will be looking at is where crude oil imports enters South Africa. The majority of crude oil enters South Africa via shipping vessels, thus the main points of entry is at various harbours in South Africa.
chart created with amCharts | amCharts
As the pie chart above shows the main point of entry for crude oil into South Africa is Durban. And the main reason for that is the fact that there is large crude oil refining capacity in in Durban. Thus the crude oil is dropped off close to where it will be refined to make fuel and jet fuel. Other points of entry is probably only used when Durban harbor is full and ships are rerouted to other ports for processing. Next question that most people ask is which country's crude oil is the cheapest? Well we take a look at the price per kilogram paid by South Africa for crude oil from the various countries it has imported crude oil from since January 2010.
Note we took the data as obtained from Customs. Certain classification problems might be contained in the data as it is highly unlikely that South Africa imported crude oil from Germany or Israel for example. We suspect the "crude oil" as coded by customs from Germany might have been motor engine oil.
chart created with amCharts | amCharts
Readers will note that the majority of countries in the list above is either middle eastern countries or central to west African countries. This is due to the fact that the largest oil deposits in the world that is currently being extracted is in the middle east and west African countries. Prices paid per kilogram of crude oil imports from the main crude importing countries seem to be very similar. As there is small differences between Saudi Arabia, Nigeria and Angola for example. The large price variations comes into play from countries such as Germany which we already mentioned we suspect is due to mis classification at SARS's customs office.
So what is the average amount of crude oil South Africa imports per month? the following bar chart shows the average amount of crude oil imported per month per year.
chart created with amCharts | amCharts
The bar chart below shows the average monthly value and quantity of crude oil imports into South Africa per year, from 2010 up to June 2017. Interestingly in 2015 South Africa imported a lot of crude per month. Far more than any of the other years, and in 2016 and 2017 so far crude oil imports is at the lowest levels yet. The table below shows the above graphic in table format.
Year
Value (Rand)
Quantity (kg)
2010
6.8bil
1.6bil
2011
8.5bil
1.5bil
2012
10.8bil
1.6bil
2013
11.8bil
1.6bil
2014
14.7bil
1.8bil
2015
8.2bil
1.6bil
2016
8bil
1.7bil
2017
8bil
1.6bil
The declining imports of crude oil (in terms of number of kilograms from 2014 to current 2017 levels) could point to a few things.
1. Cars are becoming more fuel efficient thus less crude oil required to produce petrol as less petrol is being used
2. More car pooling and greater use of public transport by South Africans
3. Struggling consumers are more conscious about their driving habits and drive less often in order to save on petrol.

We suspect it a combination of all 3 of these elements. And with electric cars gaining more traction we suspect that this declining trend in volume of crude oil imports in South Africa will continue.

Let us know what you thought of this article:


Additional content:

Related Topics

  • South Africa's Trade Data Page​


​Homepage

Economics Page
Stock in Focus Page


​About


Contact Us

Copyright © 2015
  • Home
  • Blog
    • Blog-5Jun2018
    • Blog-18May2018
    • Blog-16May2018
    • Blog-3May2018
    • Blog-2May2018
    • Blog-30Apr2018
    • Blog-26Apr2018
    • Blog-24Apr2018
    • Blog-18Apr2018
    • Blog-17Apr2018
    • Blog-16Apr2018
    • Blog-3Apr2018
    • Blog-22Mar2018
    • Blog-20Mar2018
    • Blog-19Mar2018
    • Blog-23Oct2017
    • Blog-20Oct2017
    • Blog-11Oct2017
    • Blog-10Oct2017
    • Blog-6Oct2017
    • Blog-3Oct2017
    • Blog-2Oct2017
  • Economics
    • Rand Dollar Exchange Rate
    • South Africa's GDP
    • South Africa's Unemployment
    • SA by numbers
    • Economic Progress Index
    • Taylors Rule
    • South Africa's Formal Business Sector
    • South-Africa's-Fiscal-Policy
    • SA EU Trade Data
    • Inflation Heat Map
    • Population Density Map
    • Labour Market Dynamics
    • Estimating the Size of the Informal Economy
    • SA Consumer Spending Patterns
    • South Africa's Monetary Fiscal Policy Mix
    • GDP Animations >
      • SouthAfrica
      • WesternCape
      • EasternCape
      • NorthernCape
      • FreeState
      • KwaZuluNatal
      • NorthWest
      • Gauteng
      • Mpumalanga
      • Limpopo
    • South Africa's Economic Structure
    • South Africa's Economic History
    • South Africa's Trade Data Page
    • South Africa's Food and Beverages Sector
    • Financial Well-being of South African Companies_2015
    • SA vs the World
    • Budget Day Page (24 Feb 2016)
  • Stock in Focus
    • JSE ALSI Chart
    • Sector Comparison Page
    • JSE-Calendar-Tracker-2019
    • Adcorp (ADR)
    • Amazon (AMZN)
    • Apple (AAPL)
    • Ascendis (ASC)
    • AVI (AVI)
    • Bidvest (BVT)
    • Blue Label Telecoms (BLU)
    • Bowler Metcalf (BCF)
    • Capitec (CPI)
    • City Lodge Hotel Group
    • Clicks Group (CLS)
    • Coronation (CML)
    • Curro Holdings (COH)
    • Discovery (DSY)
    • Distell (DST)
    • EOH (EOH)
    • Famous Brands (FBR)
    • Ferrari (RACE)
    • FirstRand Group (FSR)
    • Grindrod (GND)
    • GrowthPoint (GRT)
    • Holdsport (HSP)
    • Harley-Davidson (HOG)
    • Hyprop (HYP)
    • Hyprop (HYP)_1Jun2016
    • Investec Property Fund (IPF)
    • JSE (JSE)
    • Massmart (MSM)
    • MediClinic (MEI)
    • MTN (MTN)
    • MTN (MTN)_May2016
    • Mr Price Group (MRP)
    • Mr Price Group (MRP)_8APR2016
    • Nedbank (NED)
    • OneLogix (OLG)
    • Peregrine Holdings (PGR)
    • Pick 'n Pay Stores (PIK)
    • Pioneer Foods (PFG)
    • PSG Group (PSG)
    • Quantum Foods (QFH)
    • RCL Foods (RCL)
    • Remgro (REM)
    • Richemont (CFR)
    • RMB Holdings (RMH)
    • Rolfes (RLF)
    • Sanlam (SLM)
    • Sasol (SOL)
    • Sasol (SOL)_18sep2016
    • Santova (SNV)
    • Spar Group (SPP)
    • Shoprite Holdings (SHP)
    • Spur Corporation (SUR)_7Sep2017
    • Standard Bank (SBK)
    • Steinhoff International Holdings (SNH)
    • Stor-Age (SSS)
    • Super Group (SPG)
    • Taste Holdings (TAS)_30May2016
    • The Foshini Group (TFG)
    • Value Logistics (VLE)
    • Vodacom (VOD)
    • Wilson Bayly Holmes Ovcon (WBO)
    • Woolworths (WHL)
    • Woolworths (WHL)_24Aug2017
    • Zeder (ZED)
  • Online Calculators
    • Rand Petrol Price Estimator
    • Share Valuation
    • Financial Ratios Calculator
    • GDP Growth Estimator
    • Future Value of Investment Calculator
    • Loan repayment calculator
  • Contact
  • About
  • Search