|
Related Topics |
|
We take a look at the latest financial results from listed Telecoms operator MTN for the year ending December 2019. The mobile operator has been struggling for years largely due to issues in some of their biggest markets such as Iran and Nigeria. But it looks like Nigeria, the biggest economy in Africa is starting to pay off for MTN
|
|
About MTN
For those who dont know anything about MTN. Below a brief description of what the group is about.
MTN is a leading emerging market mobile operator, serving 233 million subscribers in 21 countries across Africa and the Middle East. MTN Group Ltd. is a pure-play emerging markets mobile telco operator at the forefront of technological and digital changes. The Group offers voice, data and digital services to retail customers in the 21 countries in which its operations have telecoms licences.
According to MTN's latest financial results the following countries are the biggest contributors to the group's total revenues earned during 2019:
- Nigeria: R46.696 billion (30.8% of revenues)
- South Africa: R45.447 billion (30% of revenues)
- Ghana: R13.820 billion (9.1% of revenues)
- Ivory Coast: R6.917 billion (4.6% of revenues)
MTN store in a mall
Overview of MTN's latest results
Firstly we take a look at the financial highlights as stated by MTN's management
Now for the numbers we are interested in for the full 2019 financial year of MTN
- Subscribers increased by 18,2 million to 251 million
- Revenue grew by 9,7%*
- Service revenue grew by 9,8%*
- IFRS reported EBITDA margin improved by 6,4 percentage points (pp) to 42,3% (up 1,2 pp* to 35,5%*)
- IFRS reported EBITDA˜ (before once-off items) increased by 34,3% (up 13,6%*)
- IFRS reported group HEPS at 468 cps, up 38,9% (up 61,7% under IAS 17)
- Non-operational impacts (including IFRS 16 adoption) lowered HEPS by 209 cps -
- Holding company leverage stable at 2,2x
- Final dividend of 355 cents per share in line with guidance
- Medium-term targets enhanced
Now for the numbers we are interested in for the full 2019 financial year of MTN
- Revenue: R151.460 billion
- Profit for the period: R10.692 billion
- Net profit margin: 7.05% (down from 7.11% as at year end December 2018)
- Diluted Headline Earnings per share: R4.91
- PE ratio of MTN: 13.1
- Dividend declared for period: R5.20 per share
- Dividend yield of MTN: 8%
- Cash generated from operations: R36.289 billion
- Cash generated from operations per share: R16.72 per share
- Shareholders equity in MTN: R86.1 billion
- Shareholders equity per share in MTN: R39.67
- So MTN is trading at 1.68 times its shareholders equity per share which is outside the expected range of between 2 and 4 times that most firms tend to trade at
- Shareholders equity per share in MTN: R39.67
- Cash on balance sheet: R21.78 billion
- Cash on balance sheet per share: R10.03
- Cash on balance sheet makes up 15.4% of MTN's current market price
- Cash on balance sheet makes up 7.19% of MTN's total assets
Management commentary on the results
Group president and CEO, Rob Shuter comments:
“In 2019, the 25-year anniversary of MTN Group, we delivered solid operational execution and commercial momentum across most of our operations as well as a number of innovations that support greater digital and financial inclusiopm
In challenging trading conditions, we maintained operating leverage with a 9,8%* increase in service revenue and a 13,6%* increase in EBITDA. The group’s EBITDA margin improved by 1,2 pp* to 35,5%* on an IAS 17 basis, in line with our medium-term guidance. Our holding company leverage remained stable at 2,2x and we reduced our capex intensity to 17,5%, from 19,3%, also on an IAS 17 basis.
The group’s results were supported by double-digit growth in service revenue by both MTN Nigeria and MTN Ghana, while economic pressure, new data usage rules and a reassessment of recognition criteria for roaming revenue from Cell C impacted our performance in South Africa. We advanced our work to build a digital operator, adding 18,2 million subscribers to reach a total base of 251 million, and recording 95 million active data users and 35 million active MoMo users. This growth is central to our belief that everyone deserves the benefits of a modern connected life. In support of this, we launched a $20 smartphone during the year, following on from our $20 smart feature phone developed in 2018. To ensure Africa doesn’t miss out on the instant messaging revolution, we launched our own instant messaging platform, Ayoba, in March 2019. Ayoba is now live in 12 markets and has registered two million monthly active users.
Broadening our fintech offering remains a priority, and MoMo is now live in South Africa. In Nigeria, we received our super-agent licence and by December 2019 had 108 000 registered agents. We delivered approximately R14 billion of asset realisations within the first 12 months of our three- year R15 billion asset realisation programme. We moved towards more localisation of operations, most notably with the listing of MTN Nigeria, and recorded progress on various regulatory issues, including the AGF matter on taxes in Nigeria. Relationships with stakeholders across our markets improved, and we reported our highest employee engagement score yet.
nspired to harness the pioneering spirit that has built MTN over the last 25 years we remain committed to delivering on our strategy in a more agile way in close collaboration with our many partners, with whom we are #GoodTogether. Given the progress and momentum we are seeing in our commercial, financial and strategic initiatives, we have enhanced our medium-term guidance framework. While we maintain our medium-term service revenue, EBITDA, capex and ROE objectives, we are increasing our medium-term (3-5 years) targets for our asset realisation programme to at least a further R25 billion and are reducing our holding company leverage target ratio to below 2,0x.”
Advertisement
Share Price Performance of MTN
The screenshot below, taken from Sharenet shows the share price performance of MTN over the last 10 years. It also shows the stock's performance over various time frames as well as the sharp increase in the share price today following the release of the financial results
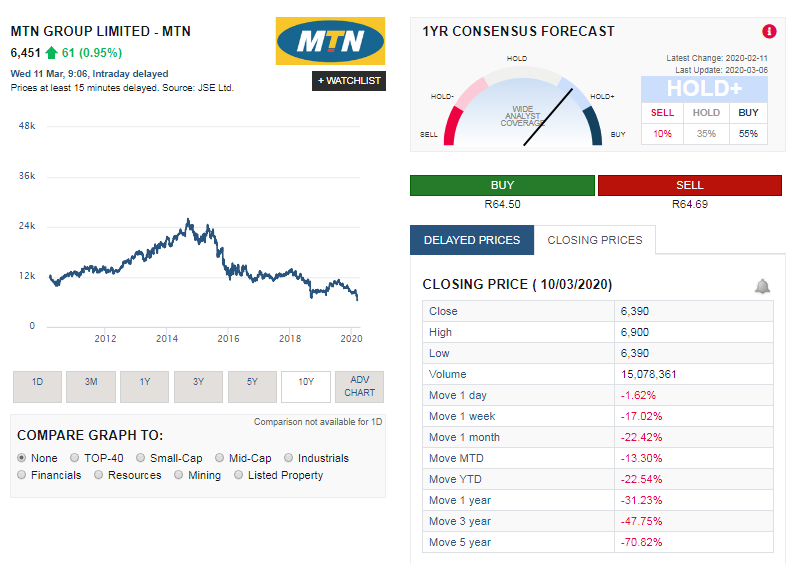
The summary below shows the performance of MTN's share price over various time periods:
So its clear MTN shares have not been performing very well and has left investors pretty bruised and battered. And the recent market fears brought about by the Coronavirus and the oil price war between Saudi Arabia and Russia which sent oil prices plunging has not helped overall market sentiment or the sentiment around MTN's stock price.
- 1 week:-17.02%
- 1 month: -22.42%
- Year to date (YTD): -22.54%
- 1 year: -31.23%
- 3 years: -47.75%
- 5 years: -70.82%
So its clear MTN shares have not been performing very well and has left investors pretty bruised and battered. And the recent market fears brought about by the Coronavirus and the oil price war between Saudi Arabia and Russia which sent oil prices plunging has not helped overall market sentiment or the sentiment around MTN's stock price.
MTN shares valuation
So what do we value MTN shares at based on their latest financial results? Based on their results, the markets they operate in and the strong balance sheet, low PE ratio and very high dividend yield our valuation model provides a full value price (target price) of R106.60 per MTN share (up from our interim period 2019 valuation of MTN).
We usually recommend that long term fundamental or value investors look to enter a stock at least 10% below our full value price which in this case is R106.60. A good entry point into the shares of MTN would therefore be at R95.90 or below.
Since the stock of MTN is trading at well below our suggested entry point into the share we rate the shares of MTN as a buy