|
Sunburst chart of South Africa's JSE All Share Index
Date: 18 October 2018 Category: Stock Market |
Related Topics |
|
We take a look at the JSE All Share market capital data, as supplied to us by our good friends at PSG. And display the market capital of the various sectors and shares on a sunburst chart.
We have a few massive companies listed on the JSE All Share, with the overall market cap amounting to over R10 trillion, which is roughly 3 times the size of South Africa's economy. |
|
So which sectors and shares are the biggest on the JSE?
Well while South Africa's economy is largely based on primary goods such as agriculture, commodities and basic materials, we do have a large number of shares not contained within these sectors that make up a significant chunk of the overall JSE All Share market capital. Perhaps this shows that South African businesses are very concentrated. I.e there is not enough competition and big chunks of various sector's market share is made up by a select few companies.
While this is definitely the case for some sectors, there are others in which there is extremely strong competition, and that is excluding companies that are active in various sectors and which are not listed on the JSE.
So what does the JSE All Share Index look like at first glance? Well the sunburst chart below should provide readers with a good overview of which sectors and shares on the JSE are signifcant.
No real surprise is the fact that Naspers and British American Tobacco takes the cake on the JSE All Share Index. With British American Tobacco's market capital making up 12.59% of the JSE All Share market capital Naspers making up just over 10.9% of the All share market capital.
Other noteworthy large firms include:
BHP Billiton: 5.59%
Richemont: 5.43%
Glencore: 7.66%
First Rand: 3.14%
Anglo American: 3.72%
Sasol: 2.99%
Standard Bank: 2.42
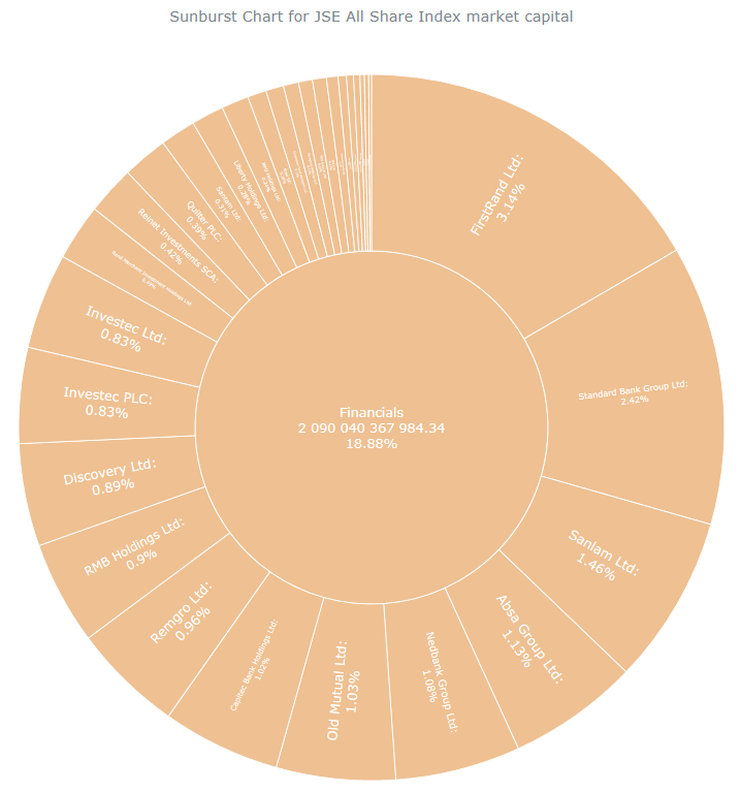
Users can drill down into a particular industry to zoom in on greater detail. The image below shows the drill down of the Financials sector. As the image shows the relative sizes of the various firms are fairly similar.
Other noteworthy large firms include:
BHP Billiton: 5.59%
Richemont: 5.43%
Glencore: 7.66%
First Rand: 3.14%
Anglo American: 3.72%
Sasol: 2.99%
Standard Bank: 2.42
Users can drill down into a particular industry to zoom in on greater detail. The image below shows the drill down of the Financials sector. As the image shows the relative sizes of the various firms are fairly similar.
From a sector point of view there is a pretty even spread in terms of the relative importance of the various sectors listed on the JSE:
Enjoy the interactive graphic and once again thanks to our friends at PSG-Online for providing us with the data to develop this graphic.
- Communication services: 14.47% (largely driven by Naspers)
- Consumer discretionary: 9.31% (largely driven by Richemont)
- Consumer staples: 17.71 (largely driven by British American Tobacco)
- Financials: 18.88% (relatively even spread among firms in this sector)
- Materials: 30.09% (largely driven by BHP Billiton and Glencore)
- Real Estate: 5.63% (relatively even spread among firms in this sector)
Enjoy the interactive graphic and once again thanks to our friends at PSG-Online for providing us with the data to develop this graphic.