|
Related Topics |
|
We take a look at the Johannesburg Stock Exchange All Share Index performance and compare it to the Dow Jones Industrial Average performance. How has the JSE All Share Index held up against the Dow Jones during the recent market sell off triggered by the Coronavirus?
|

|
19 March 2020: JSE All Share Index (J203) vs Dow Jones Industrial Average
With the world markets continuing its downward spiral and the poor bulls looking to prop up the market and trying to force it to find a new bottom, it remains interesting to compare the performance of different indices across the world with one another. The graphic below shows an updated graphic of the Dow Jones compared to the JSE All Share Index (j203) up to end of trade 18 March 2020
JSE All Share Index (J203) compared to the Dow Jones Industrial Average
So with world markets experiencing one of the biggest sell offs in history, and certain trading days in the recent past seeing bigger declines than the infamous Black Monday, just how has the Johannesburg Stock Exchange All Share Index held up against one of the most quoted stock indices in the world, the Dow Jones Industrial Average.
The interactive graphic below shows the performance of the JSE All Share Index over the last month. As soon as users click on the Dow Jones Industrial Average, the chart adds the performance of the Dow Jones Industrial Average, and it shows the performance of the last month for the Dow Jones and the JSE All Share Index over the last month.
Users can enter their own dates within the last 5 years and the graphic will recalculate the return of the JSE All Share Index and the Dow Jones, or users can select any of our predefined dates under the zoom heading.
The summary below shows the returns provided by the JSE All Share Index and the Dow Jones Industrial Average over the last month:
- Dow Jones: -27.32%
- JSE All Share Index: -30.68%
Performance of the JSE All Share Index vs the Dow Jones over various time periods
The image below shows the performance of the JSE All Share Index and the Dow Jones for the Year to Date (YTD).
So since the start of 2020 the JSE All Share Index has slightly under-performed against the Dow Jones Industrial Average. But the overall trends and magnitude of movements in either direction is very similar.
- Dow Jones: -26.43%
- JSE All Share Index: -29.82%
So since the start of 2020 the JSE All Share Index has slightly under-performed against the Dow Jones Industrial Average. But the overall trends and magnitude of movements in either direction is very similar.
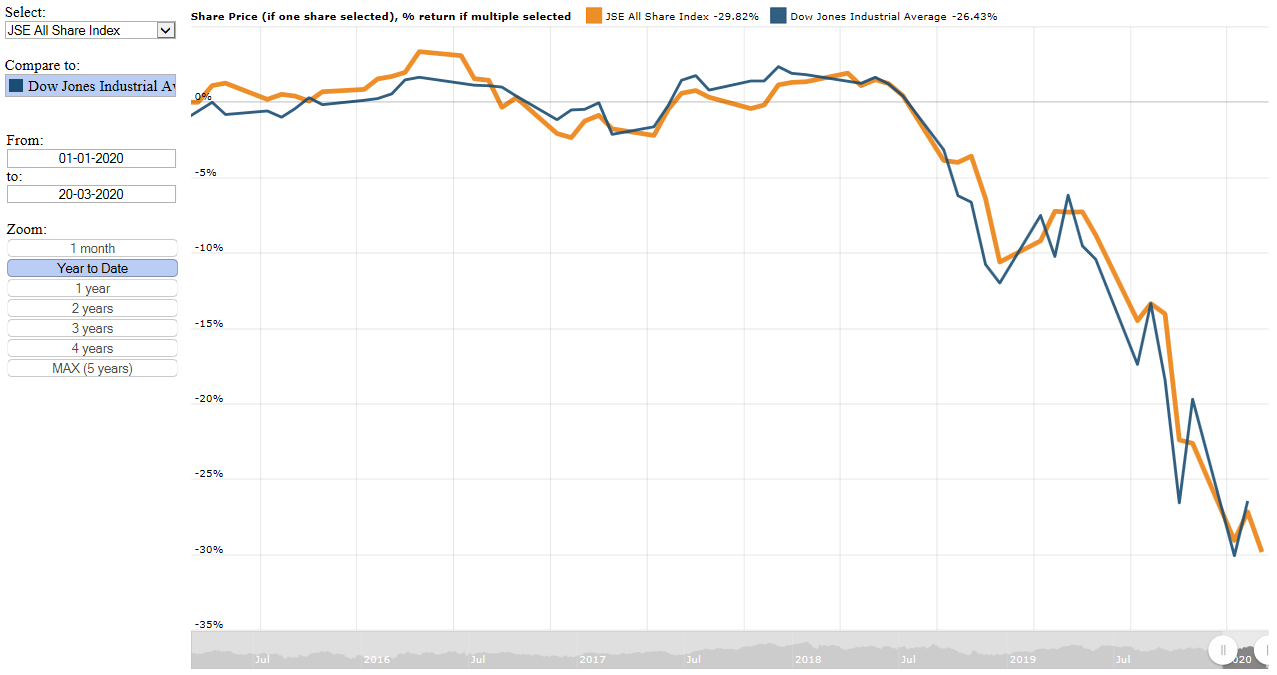
JSE All Share Index performance plotted against the Dow Jones Industrial Average since the start of the year
Looking at the performance of the JSE All Share Index and the Dow Jones Industrial Average there is a bit more divergence taking place than the graphic above for the Year to Date. The summary below shows the returns provided by the JSE All Share Index and the Dow Jones over the last year
- Dow Jones: -16.72%
- JSE All Share Index: -28.60%
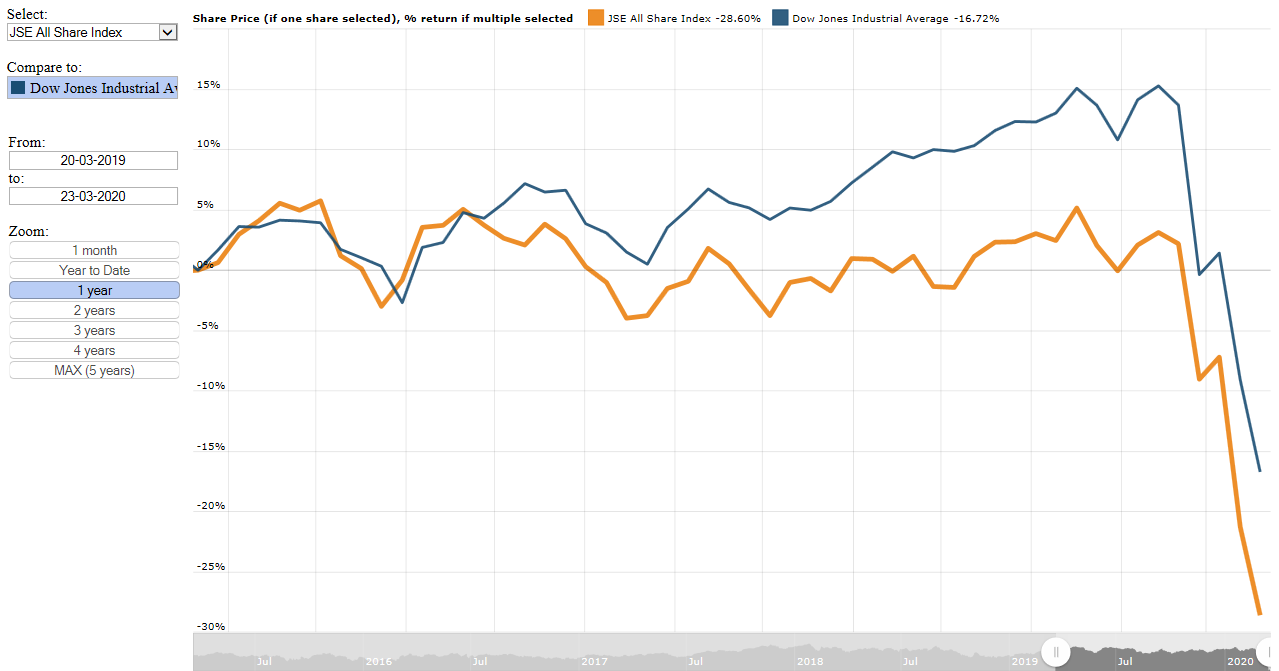
JSE All Share Index performance plotted against the Dow Jones Industrial Average over the last 12 months
So over the period of a year, as per the image above there is quiet a bit of divergence between the performance of the JSE All Share Index and the Dow Jones, than over the period for example Year to Date. With the Dow Jones being almost 13% better off than the JSE All Share Index over the period of 1 year while the year to date difference is roughly 3.5%. Moving to an even longer time period, of say 3 years the divergence increases even more. The image below shows the performance of the JSE All Share Index and the Dow Jones over the last 3 years.
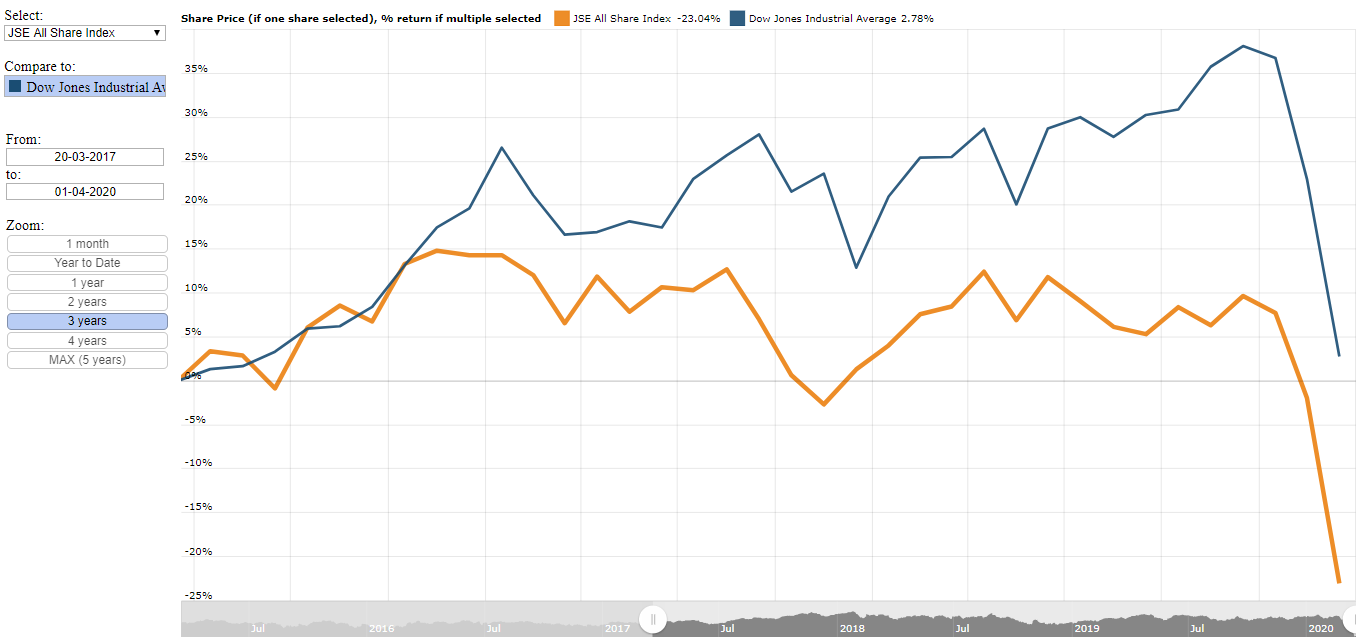
JSE All Share Index performance plotted against the Dow Jones Industrial Average over the last 3 years
The summary below shows the returns provided by the JSE All Share Index and the Dow Jones Industrial Average over the last 3 years
So over the last 3 years the Dow Jones Industrial Average is better off by roughly 26%, while over a year period it was better off by about 13% and for the 2020 year to date it was better off by about 3.5%. So the longer the time period the bigger the difference in the performance between the JSE All Share Index and the Dow Jones.
This certainly makes the case for South Africans to invest off shore and to get exposure to foreign markets and indices such as the Dow Jones Industrial Average of the S&P 500.
- Dow Jones: 2.78%
- JSE All Share Index: -23.04%
So over the last 3 years the Dow Jones Industrial Average is better off by roughly 26%, while over a year period it was better off by about 13% and for the 2020 year to date it was better off by about 3.5%. So the longer the time period the bigger the difference in the performance between the JSE All Share Index and the Dow Jones.
This certainly makes the case for South Africans to invest off shore and to get exposure to foreign markets and indices such as the Dow Jones Industrial Average of the S&P 500.