|
Related Topics |
|
In this article we focus on the results of a survey published by Statistics South Africa called Survey of Employers and Self Employed. And this particular survey has a large focus area, which is the informal sector and economy of South Africa.
According to Stats SA, The SESE report aims to provide information about the characteristics of businesses in the informal sector in South Africa, and provides an understanding of their operation and access to services. The information presented in this report supplements the Quarterly Employment Statistics Survey (QES) that collects information from formal sector businesses that are registered for VAT. |
|
High level results of the survey
So have you ever wondered how many people are employed in the economy? Or how many businesses there are in South Africa that are not VAT registered? Or where the most informal sector economic activity takes place? The following might answer some of your questions regarding South Africa's informal economy. Note these are the key results as obtained from Stats SA.
• The number of persons who ran informal businesses declined from 2,3 million in 2001 to 1,1 million in 2009, before increasing to 1,8 million in 2017.
• Approximately 95% of informal business owners had only one business, and the majority of them have been operating the business for five years or longer.
• Gauteng (28,6%), followed by Limpopo (16,5%) and KwaZulu-Natal (14,7%), had the highest share of informal businesses.
• In 2017, men were more likely to run informal businesses than women.
• Black Africans had the highest proportion of the working-age population running informal businesses over the period 2001–2017, however, their proportion declined from 9,8% in 2001 to 5,4% in 2017.
• The proportion of the working-age population running informal businesses increased with age and peaked at 44–45 years.
• More than 70% of non-VAT registered businesses did not keep financial records. In 2017, 67,8% of persons running these businesses had less than matric qualification.
• More than 90% of persons who ran informal businesses did so without a licence or permit, and the majority of those who had licences or permits (40,2%) obtained them from a municipality/ provincial authority.
• The majority of informal businesses were in the trade industry, with most of them operated by men.
• Seven in every ten persons running non-VAT registered businesses used their own money to start the business.
• Unemployment was the main reason why most people started their businesses, accounting for more than 60% of the business owners.
• More than nine in every ten businesses had no business debt, credit facility, mortgage loan or asset finance.
• Among the non-VAT registered businesses, the Manufacturing industry had a higher proportion of businesses that used raw materials compared to any other industry, while businesses in the Trade industry had the highest proportion that used supplies compared to other industries.
• Eight in every ten persons in informal businesses did not have bank accounts. Among those who had bank accounts, more than 60% used them mainly to make business payments.
• In 2017, 88,5% of employees in informal businesses were paid employees compared to 65,3% recorded in 2001.
• The majority of employees in informal businesses were working in the Construction industry at 33,3%.
• The majority of the employers running non-VAT registered businesses accumulated total labour costs below R1 500 over the period 2001–2017. The proportion of those who accumulated total labour costs of R6 001+ increased from 2,8% to 14,1%.
• The proportion of persons running informal businesses with a turnover in the last month above R3 001 were higher among men compared to women. There was a huge gender gap of about 10,3 percentage points for persons who had a turnover of above R6 001, where men and women recorded 22,5% and 12,2% respectively in 2017.
• The highest proportions for those who had turnover above R6 000 in the last month in 2017, were in the Secondary (21,9%) industries.
• Larger proportions of women compared to men made net profits below R1 500.
• The highest proportions for those who earned net profits above R6 000 in the last month were in the Primary (17%) and Secondary (17,6%) industries in 2017.
The image below breaks down the percentage of people working for non-vat registered businesses by gender
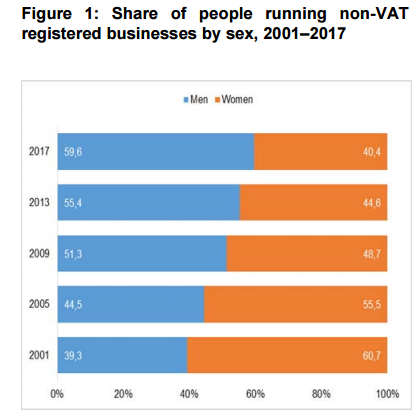
As the image above shows over time the percentage of men working in non-vat registered enterprises are increasing and by 2017, 59.6% of people working for non-VAT registered businesses were men. While this was sitting at 39.3% in 2001. The image below shows the length of time the non-VAT registered business has been operating, broken down per year.
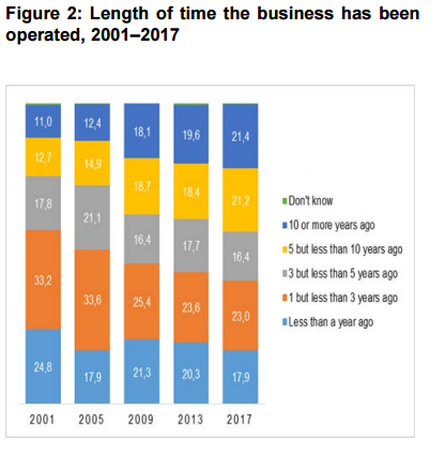
Interestingly over time the percentage of non-VAT registered businesses that have been operating for less than one year has been declining, showing less and less new non-VAT registered businesses are being started. In 2017, the largest grouping was sitting between 1 and 3 years operating periods, and only 17.9% of non-VAT registered businesses said their non-VAT registered business have been operating for less than 1 year.
Lets take a look at the proportion of working age population running non-VAT registered businesses per race group below
Lets take a look at the proportion of working age population running non-VAT registered businesses per race group below
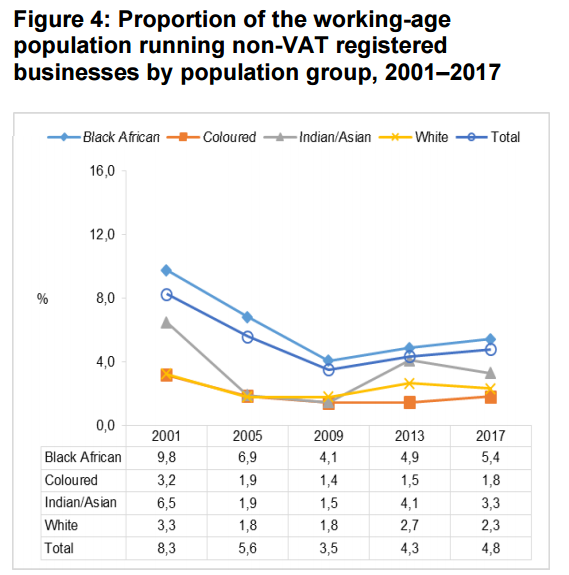
The proportion of the working-age population running informal businesses declined from 8,3% in 2001 to 3,5% in 2009, before increasing to 4,3% and 4,8% in 2013 and 2017, respectively. The image above shows the shares of those running non-VAT registered businesses decreased for all population groups between 2001 and 2017. Among black Africans, the share of those with informal businesses declined from 9,8% in 2001 to 4,1% in 2009. However, for the white population group, the proportion remained lower and unchanged between 2005 and 2009 at 1,8%, but declined to 2,3% in 2017 from 2,7% in 2013. In 2013, this downward trend was reversed and the percentage of the working-age population engaged in informal businesses increased for all population groups, but in 2017 an increase was observed in only two population groups, i.e. black Africans and coloureds, whereas the Indian/Asian and white population groups recorded declines in proportions running non-VAT registered businesses.
For more on the informal economy of South Africa see our Informal economy Page.
For more on the informal economy of South Africa see our Informal economy Page.