|
Related Topics |
|
We take a look at the latest South African Reserve Bank (SARB) Monetary Policy Review presentation as at 1 October 2019.
|
|
What is the South African Reserve Bank Monetary Policy Review?
Twice a year the South African Reserve Bank published a monetary policy review presentation which gives a broad overview of global financial markets as well as a global economic overview. The reason for this is the fact that South Africa's monetary policy is influenced by a whole host of factors which includes what is happening in local and foreign markets. The first slide of their MPR presentation starts with the heading "October MPR: Achieving the mandate in a world of risks" and then a few bullet points
• Global risks – trade tensions and global recession
• Domestic risks – shocks to fiscal position
• Low and volatile domestic growth
• Inflation contained, near the middle of the target range
• The MPC has had some policy space, but risks constraining
• Global risks – trade tensions and global recession
• Domestic risks – shocks to fiscal position
• Low and volatile domestic growth
• Inflation contained, near the middle of the target range
• The MPC has had some policy space, but risks constraining
Advertisement
The main news story with regards to economic growth over the last year has not been oil price shocks, or war, or severe droughts but rather the continued "trade war" between the United States and China. With a continuous tit for tat tariff increase cycle. When the US imposes tariffs on certain Chinese goods being imported into the USA, the Chinese respond by imposing tariffs on goods imported by China into the US. This all stems from the fact that the trade balance (the difference between value exported and imported between two countries) between the USA and China is highly skewed towards China. Basically the value of goods imported from China by the USA far outstrips the value of goods the USA exports to China. So China in essence makes more money from trade between the two nations. And this is something the current US administration under Donald Trump is looking to correct. Donald Trump has long said that the trade balance needs to even out more and that the Chinese needs to import more goods made in the USA. While we agree with Donald Trump that the trade balance needs to be corrected (the same with South Africa where China has a significant positive trade balance with South Africa). We are not sure the toxic tariff increase cycle is the best way to go about it. The continued tariff increases is leading to slower global trade, and it will have an inflationary effect as usually cheaper imported goods are becoming more expensive in the USA, and this will start affecting US consumers pockets which will have an impact on US economic growth going forward. The image below shows the slowing of world trade and the rise of economic policy uncertainty.
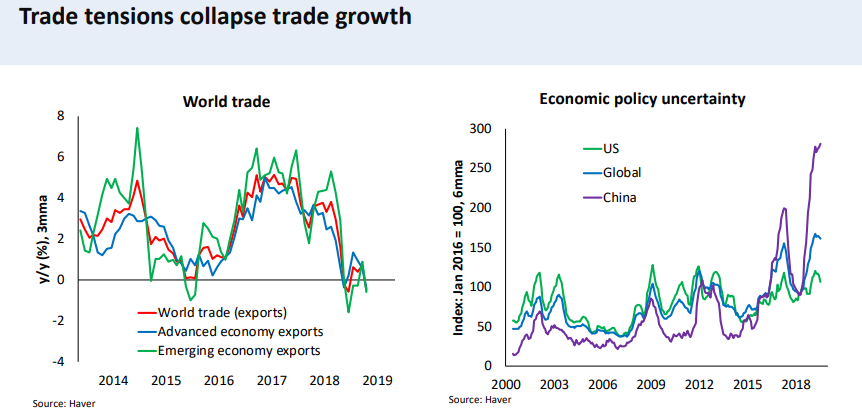
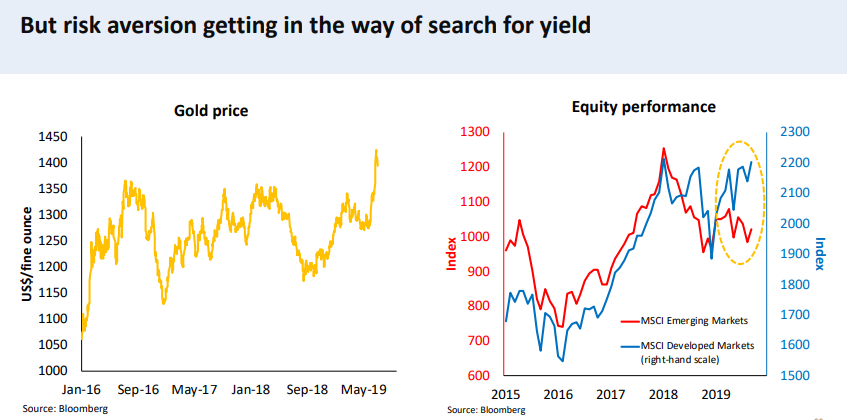
So economic policy uncertainty in the USA has spiked in recent times, especially considering the trade war dragging on between the USA and China and the continued attacks by President Trump on the Federal Reserve and their stance on the USA's monetary policy. And if there is one thing markets don't like its policy uncertainty. When policy uncertainty increases investors and markets flee to safe haven assets. Mostly gold and developed economies stock markets. The image below shows that this risk aversion has pushed up the gold price and has seen the emerging market stock markets under perform more developed markets.
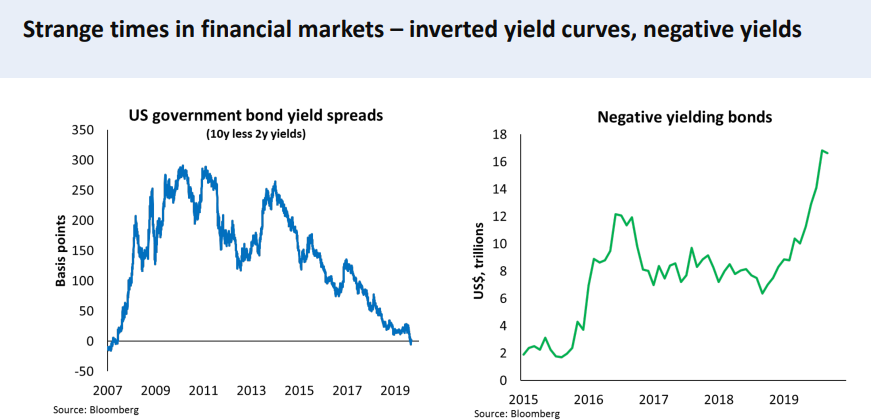
The uncertainty in economic policy in some countries and sluggish growth in other has lead to strange times in financial markets. With inverted yield curves and negative yields being the order of the day. The image below shows the US government bond yield spreads(10 yield - 2 year yields) as well as the value of negative yielding bonds which has seen a sharp increase during 2019.
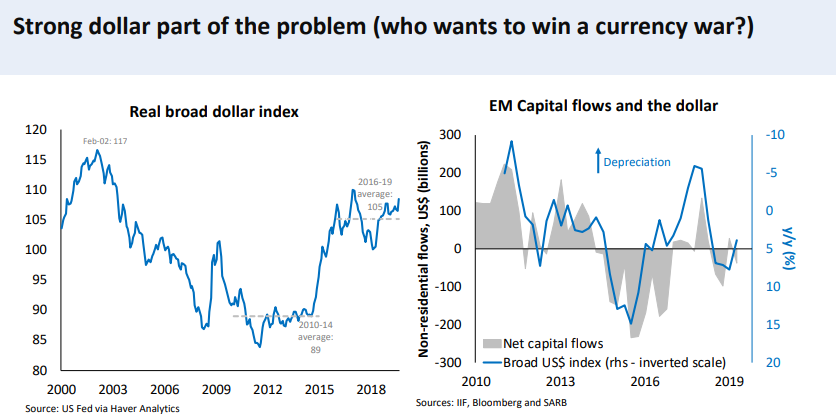
Emerging market growth is slumping and one could argue that investors looking for returns or running to the US, which leads to greater demand for the US dollar (so it will appreciate or get stronger) and one would see a corresponding decline in capital flows into emerging markets. The image below illustrates this pretty well
Relating the above to South Africa the image below shows the increase in South Africa's government debt, as it keeps taking on more and more debt to bail out ESKOM, South African Airways, DENEL, the SABC and a whole host of other State owned enterprises. This while taxes collected are declining in South Africa and there is less investment in the country.
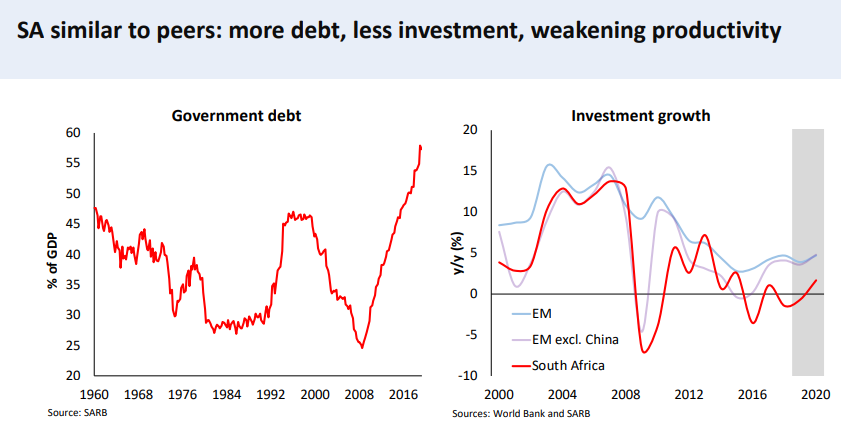
While the trend in investment growth for South Africa is similar to the rest of the emerging markets its the magnitude that is the problem for South Africa. There is far bigger declines in South Africa's investment growth that the other emerging markets. And this is largely due to ESKOM and continued worries about stable power supply in South Africa, the policy of expropriation of land without compensation. Why would anyone invest here if they run the risk of it being taken without being compensated for it. Property rights is one of cornerstones of modern capitalist economies. And if this cannot be protected investment wont take place at the rate the South African government wants. Unfortunately populist policies like these will do nothing to instill confidence and hope in the South African economy. In fact it does exactly the opposite. Ask our northern neighbors Zimbabwe how this policy worked out for them when they started taking over farms.
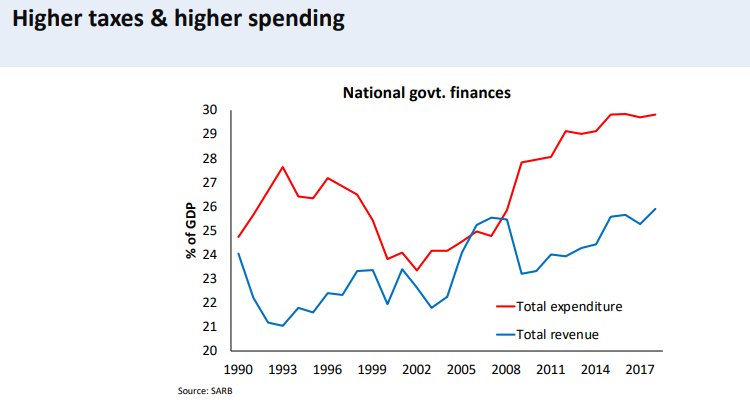
We mentioned earlier taxes collected are declining, and the only way the government can compensate for it is raising the tax rates and levying even more taxes. Tax revenues collected makes up roughly 25% of South Africa's GDP while government spending makes up almost 30% of South Africa's GDP. See the image below
The net effect of the struggling South African government finances (fiscal policy), the South African government has no choice but to offer investors in their debt higher yields in order to convince them to part with their money and borrow it to the South African government. The impact of this is that future taxes collected are going towards servicing debt instead of supplying services to the people of South Africa. the image below shows the yield curves on SA government bonds and the real 10 year government bond yield.
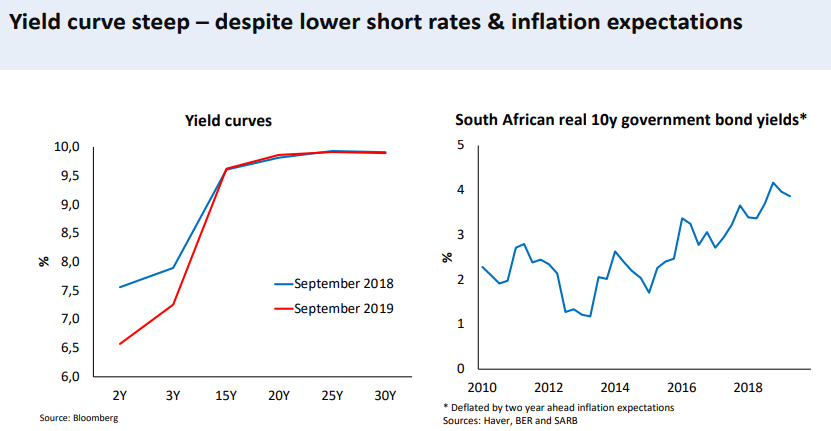
With the 10 year government bond yield offering almost 4% real return a year, the government is paying a hefty premium to borrow money. And as their fiscal position deteriorates further the premium demanded will increase. The South African government is caught in a debt trap that they have no idea how to get out of. One of the main reasons for the state's poor fiscal position is ESKOM, and they have a significant impact on the potential and achieved growth of the South African economy. The image below shows the potential and actual growth for South Africa over the lat 10 years
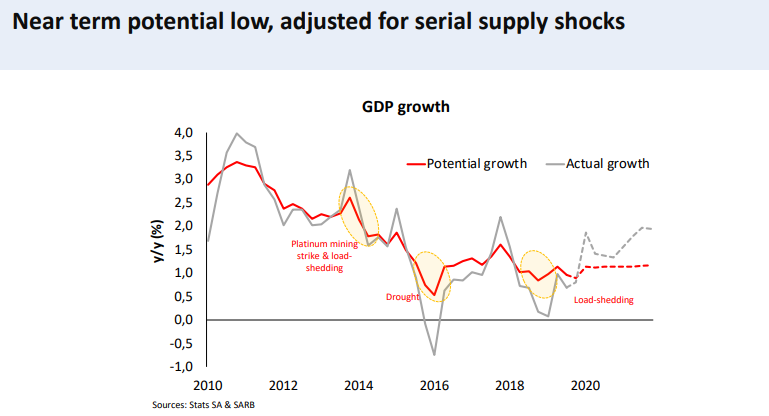
The impact of ESKOM's load shedding is clear with a slump in South Africa's economic growth during the 1st quarter of 2019. So ESKOM is not only dragging the South African finances down with the continued bail outs by the SA government of ESKOM but it's also a major contributor to the fortunes or misfortunes of the South African economy. So essentially the South African government is being held hostage by one of its state owned entities as a collapse of ESKOM would see a collapse of South Africa's economy, which is the last thing the South African government would want. So they are keeping it afloat at all costs.
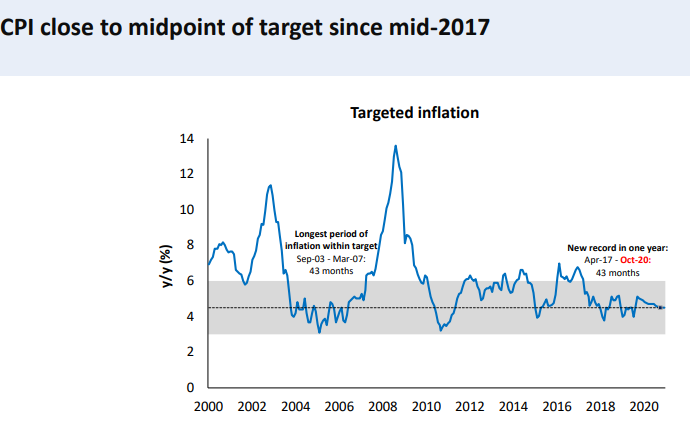
Moving away from South Africa's economic growth to focus on its inflation, the image below shows that the South African inflation rate (CPI) has been close to the mid point of the South African Reserve Bank inflation target of between 3% and 6% since the middle of 2017.
Moving away from South Africa's economic growth to focus on its inflation, the image below shows that the South African inflation rate (CPI) has been close to the mid point of the South African Reserve Bank inflation target of between 3% and 6% since the middle of 2017.
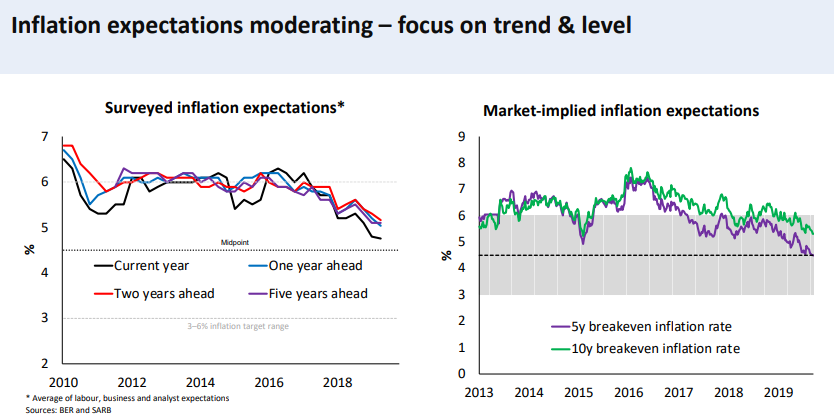
According to the South African Reserve Bank the short term inflation expectations is for inflation to be above the mid point of 4.5%, to levels close to our just above 5%. But as we said in the past we have an issue with inflation expectations of the South African Reserve Bank as they take the average of labour (who we know expects way more than what is settled for). Our belief is that inflation expectations of the Reserve Bank is skewed to the upside because of the inclusion of labour in these numbers.
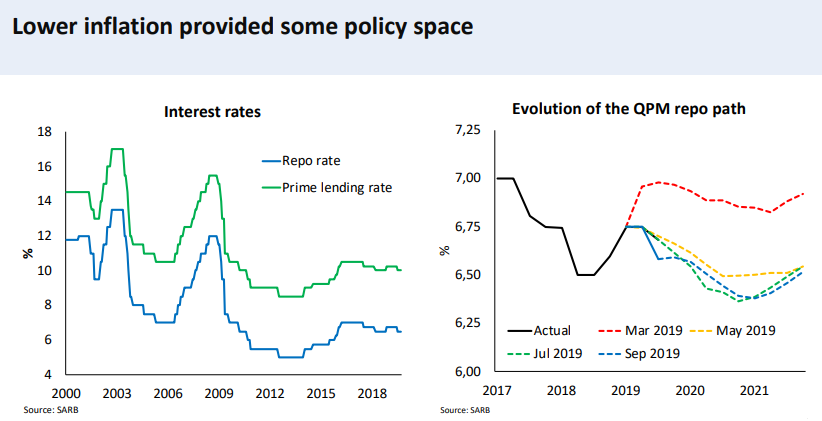
The lower rates of inflation in recent times has provided the South African Reserve Bank Monetary Policy with a bit of monetary policy space, and due to this we saw 25 basis point cut in interest rates earlier in the year. But according to us we needed a far larger cut to rates to get the economy going and to assist over indebted consumers get on top of their debt repayments. The image below shows the interest rate levels for South Africa from 2002 up to current as well as the evolution of the Reserve Bank's quarterly projection model (QPM) repo path over time.
And while we maintain that the South African Reserve Bank MPC should have cut interest rates by a lot more than 25 basis points the South African Reserve Bank believes that the Real Repo Rate is close to the neutral level. Real Repo rate is the Repo rate - inflation. The image below shows the Real Repo rate and the neutral Real Repo rate according to the South African Reserve bank
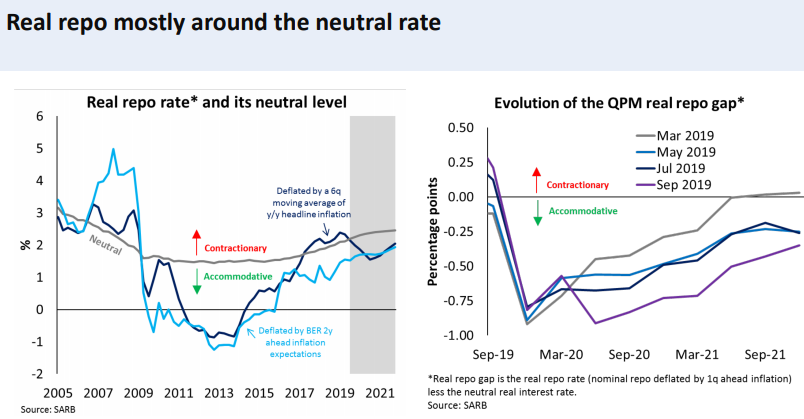
We dont see why the Real Repo neutral rate is around 2%. There is no real justification that the Repo rate needs to be 200basis points above the inflation rate. And if the bank wasn't so obsessed about having a Real Repo rate around the neutral (2%) then a far larger interest rate cut could have been implemented when they cut rates by 25 basis points. But unfortunately we dont have the final say in setting monetary policy. All we can do is ask the questions and provide information pertaining to interest rates to our readers.