|
Related Topics |
|
We take a look at the interim financial results of KAP Industrial Holdings for the 6 months ended 31 December 2018.
KAP Industrial Holdings Limited (KAP) is a JSE-listed diversified industrial group consisting of industrial, chemical and logistics businesses. The group is focused on delivering on its strategy of being a market leader in the industries it serves in a growing African market. |
|
About KAP
KAP Industrial Holdings Limited (KAP) is a JSE-listed diversified industrial group consisting of industrial, chemical and logistics businesses. The group is focused on delivering on its strategy of being a market leader in the industries it serves in a growing African market.
In July 2003, Daun & Cie gained control of Kolosus, a JSE-listed company, which was used as the basis for new transactions, mainly the acquisition of a diversified group of manufacturing companies. Kolosus then became KAP, with the new name being derived from the German translation of the Cape of Good Hope (Kap der Guten Hoffnung) and was listed on the JSE in 2004.
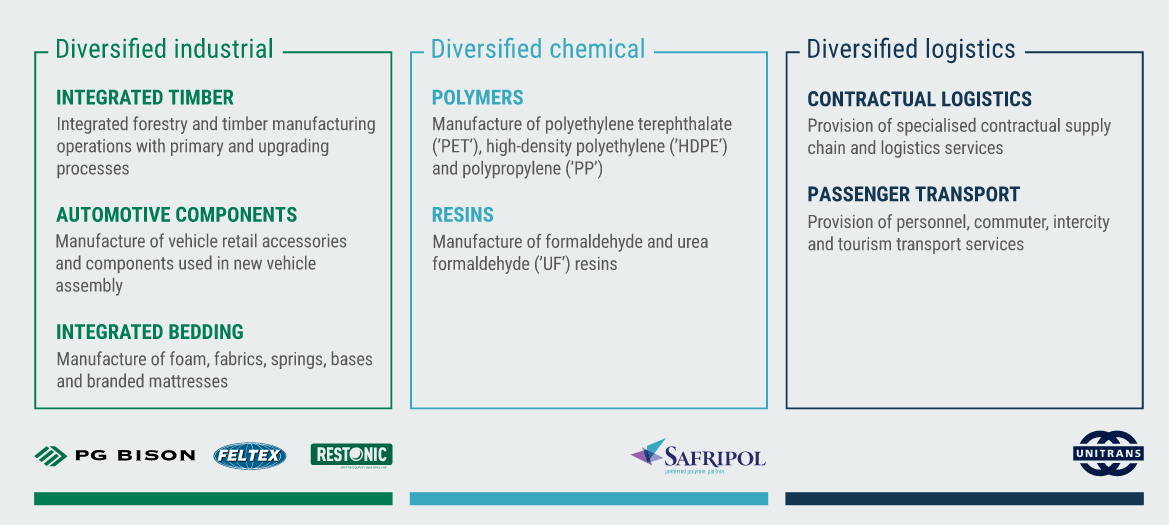
KAP acquired the industrial assets of Steinhoff Africa in 2012, and restructured into three distinct segments – diversified industrial, diversified chemical and diversified logistics – in January 2017. KAP is now truly a leading industrial business in southern Africa and has moved from a small-cap to a mid-cap listed company on the JSE. “KAP is independently funded, independently managed with strong governance structures, and maintains a clear strategy with a very effective management team.”
The image below provides a more detailed overview of KAP's divisions and their products and services delivered
In July 2003, Daun & Cie gained control of Kolosus, a JSE-listed company, which was used as the basis for new transactions, mainly the acquisition of a diversified group of manufacturing companies. Kolosus then became KAP, with the new name being derived from the German translation of the Cape of Good Hope (Kap der Guten Hoffnung) and was listed on the JSE in 2004.
KAP acquired the industrial assets of Steinhoff Africa in 2012, and restructured into three distinct segments – diversified industrial, diversified chemical and diversified logistics – in January 2017. KAP is now truly a leading industrial business in southern Africa and has moved from a small-cap to a mid-cap listed company on the JSE. “KAP is independently funded, independently managed with strong governance structures, and maintains a clear strategy with a very effective management team.”
The image below provides a more detailed overview of KAP's divisions and their products and services delivered
So to the numbers we go
Highlights of the financial results reported by KAP in their financial results are as follows:
The numbers we are interested in are discussed below:
- Revenue up 16%
- EBITDA* up 10%
- Core operating profit* up 7%
- Operation profit down 6% (due to non-cash B-BBEE cost)
- Core headline earnings* per share up 6%
- Headline earnings per share down 19% (due to non-cash B-BBEE cost)
- Cash generated from operations up 83%
The numbers we are interested in are discussed below:
- Core Headline Earnings per share: 30.1c per share (up 6% from 28.3c for the prior period)
- PE Ratio: 13.6 (assuming second half earnings equals first half earnings)
- Dividend yield: No interim dividend declared
- Profit for the period: R666 million (down 11% from R752 million for the prior period). So as much as KAP wants to swing the reduced profit as being a result of a B-BBEE cost, profit earned before deducting these costs actually declined by 11% compared to the previous period
- Cash generated per share: 32.5c a share
- Net asset value per share: R4.62 (so trading around 2 times its book value)
- Cash on balance sheet per share: 48c a share (so roughly 5.9% of the company's share price is made up by cash on balance sheet)
So any comments or guidance from management on the results?
The diligent implementation of the group's strategy has produced solid results for the period in a challenging and uncertain economic environment, particularly with regard to cash generated from operations, which increased by 83%. In previous financial periods, the group embarked on a number of significant expansion projects at its operations and concluded a number of acquisitions, resulting in the investment of R7.8 billion over the 24 months to 30 June 2018. These investments have been comprehensively reported on in previous financial reports. In view of the scale and complexity of these investments, the strategy set by the board for the 2019 financial year was to ensure the completion of the expansion projects and the effective integration of the acquisitions into the group, with the focus on market share growth, extraction of value and generation of cash. Management have made good progress during the period in this regard.
OUTLOOK/PROSPECTS
The macroeconomic and political environment in South Africa is expected to remain challenging and uncertain during the second half of the financial year in the lead-up to the national elections. KAP will continue to implement its strategy for F2019, ensuring the completion of recent expansion projects and the integration of recent acquisitions in order to extract value, generate cash and reduce debt levels, thereby strengthening its balance sheet, enhancing its competitiveness and placing it in a strong position to take advantage of growth opportunities. Various new capacity expansion projects and technology investments have been initiated that will be commissioned during F2020. Management continue to seek out further capacity expansion opportunities, in line with the group's strategy. Acquisition opportunities that meet the group's strategic requirements and create shareholder value remain a key element of the growth objectives of management.
So should you buy their shares?
To be honest we do find their product mix of goods being held rather strange. But they and their investors will argue it is a well diversified portfolio. They do hold quality assets even though it is spread across vastly different sectors. We like the management team and the strong cash position of the group. What we would like to see at some stage is the group announcing a share buy back plan as the amount of shares currently in issue being excessive.
KAP industrial holdings valuation
All things considered we value the group's shares at R10.31 a share based on their current financial results, dividends, cash generated and the markets and sectors they are exposed to. We therefore believe at it's current levels it does offer investors a bit of value, if bought at a decent enough discount to the valuation of R10.31
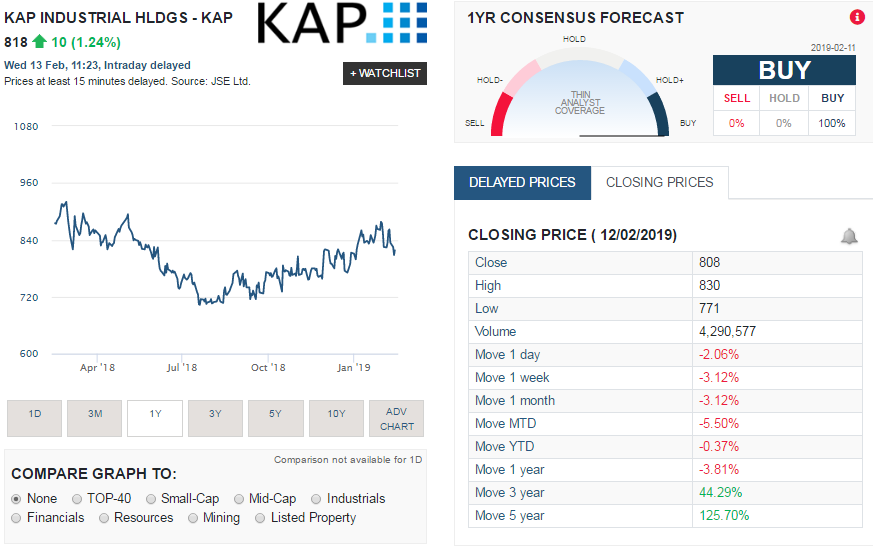
The screenshot below, taken from Sharenet shows KAP's share price performance over the last year, 3 years and 5 years. Over the longer term it has offered significant returns to shareholders.
The screenshot below, taken from Sharenet shows KAP's share price performance over the last year, 3 years and 5 years. Over the longer term it has offered significant returns to shareholders.