|
Related Topics |
|
We take a look at the performance of some the Johannesburg Stock Exchange (JSE) sub indices and compare their performance against one another over time. The indices we will be looking at are:
|

|
Consumer goods vs Consumer services vs Financials
So why compare these three indices against one another one might ask? Well in recent times the weight of services spending has increased substantially and services now makes up more than 50% of consumers spending. So the question is how has companies that are listed on the JSE that provide goods, services and financial support to consumers performed in recent years?
The interactive graphic below shows the index level for consumer services over the last month as the standard graphic. As soon as a user clicks on (Consumer Goods - light green block, or Financials- black block) in the top left hand corner the chart recalculates and shows the return of each of these indices for the last month at the top of the graphic.
Users can change the dates they want to look at and the graphic will recalculate the returns for the given date or users can select one of the pre- defined dates under Zoom. They are:
- 1 month
- 1 year (last 12 months)
- YTD- Year to date
- MAX- which in this case is three years.
So what are the returns provided by these three indices over the last month, year or 3 years?
1 Month:
1 year (last 12 months):
MAX (last 3 years):
The image below shows the returns of the three indices for the last year (12 months)
1 Month:
- Financials: 3.36%
- Consumer Services: 3.03
- Consumer Goods: - 1%
1 year (last 12 months):
- Financials: -9.08%
- Consumer Services: -17.24%
- Consumer Goods: -28.21%
MAX (last 3 years):
- Consumer Services: 29.19%
- Financials: 3.99%
- Consumer Goods: -37.35%
The image below shows the returns of the three indices for the last year (12 months)
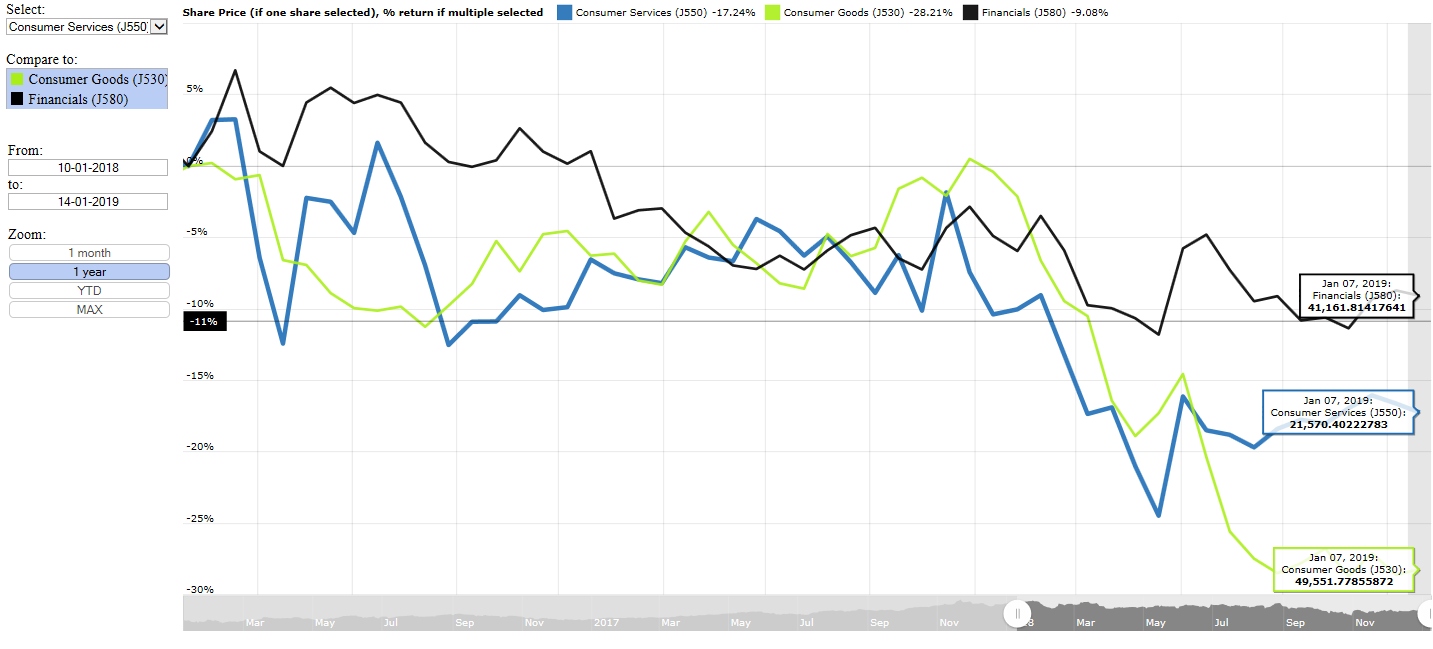
The numbers and the image above shows just how hard the market has punished listed companies over the last 12 months. While over a three year period the consumer services managed to show strong gains, the financials barely showed a positive return over three years, the consumer goods index declined by a whopping 37.5%.
Part of the reason for the strong decline in consumer goods index is due to the fact that as more and more competition enter the market to sell consumer goods, prices tend to decline, as companies lower prices to sell their goods and to move their goods faster than their competitors who then retaliate with selling at an even lower price. These type of price wars are good for keeping inflation to a minimum but it does eat into the profit margins of companies.
Whereas with services companies, there is less competition in the market for services at this point in time, while demand for services are high. This allows firms operating in the services industry the freedom to keep prices where they are or even increase them regularly which is good for these companies profit margins and it means stable or increasing profit margins while those offering goods are struggling to keep their profit margins stable.
Services prices tend to remain stable even when goods prices are declining, and the phenomenon where prices are slow to decline or even increase when other prices are decreasing is known as "sticky prices". As services prices tend to stick to the price it is at instead of declining as prices goods might do.
We will redraw this graphic in a few months as we suspect the financial index will start showing signs of increased strain as the latest interest rate hike of the South African Reserve Bank (SARB) starts to eat into consumers ability to pay back their loans and other debt owed to banks. This will lead to increased write offs by banks, which will eat into their margins and balance sheet.