|
Related Topics |
|
We take a look at an article written by our sister website, American Stock Research in which it covered the battle between The Home Depot (HD) and Lowe's (LOW), two of the largest DIY retail stores in the world. The article follows.
In our continued stock face of series we compare the stocks of two of the world's largest DIY retailers, The Home Depot (HD) vs Lowe's (LOW). Which stock has been the best performer in recent years and based on their financial results which one has the most potential to outperform in future. |
Lowe's Logo
|
More About The Home Depot (HD)
When The Home Depot was founded in 1978, Bernie Marcus and Arthur Blank had no idea how revolutionary this new “hardware store” would be for home improvement and the retail industry.Today, we’re proud to be the world’s largest home improvement retailer. In more than 2,200 stores across North America, we aspire to excel in service – to our customers, associates, communities and shareholders. That’s what leadership means to us. That's The Home Depot difference. Our founders’ vision of one-stop shopping for the do-it-yourselfer came to fruition when they opened the first two Home Depot stores on June 22, 1979, in Atlanta, Georgia. The first stores, at around 60,000 square feet each, were cavernous warehouses that dwarfed the competition and stocked 25,000 products, much more than the average hardware store at that time.
Today, The Home Depot is the world’s largest home improvement retailer with nearly 400,000 orange-blooded associates and more than 2,200 stores in the U.S., Canada and Mexico. The typical store today averages 105,000 square feet of indoor retail space, interconnected with an e-commerce business that offers more than one million products for the DIY customer, professional contractors, and the industry’s largest installation business for the Do-It-For-Me customer.
Overview of the latest quarterly earnings report of The Home Depot (HD)
Our latest stock valuation of The Home Depot (HD): $204.80
Today, The Home Depot is the world’s largest home improvement retailer with nearly 400,000 orange-blooded associates and more than 2,200 stores in the U.S., Canada and Mexico. The typical store today averages 105,000 square feet of indoor retail space, interconnected with an e-commerce business that offers more than one million products for the DIY customer, professional contractors, and the industry’s largest installation business for the Do-It-For-Me customer.
Overview of the latest quarterly earnings report of The Home Depot (HD)
- Net sales: $33.536 billion (up from $27.223 billion for the same quarter of the previous year)
- Net sales increased by 23.2% over the last 12 months
- Cost of sales: $22.088 billion (up from $17.836 billion for the same quarter of the previous year)
- Cost of sales increased by 23.8% over the last 12 months
- Some margin gain for The Home Depot as their revenues increased at a faster rate than their cost of sales
- Net earnings: $3.432billion (up 23.9% from $2.769 billion for the same quarter of the previous year)
- Diluted earnings per share: $3.18 (up 25.7% from $2.53 for the same quarter of the previous year)
- PE ratio of The Home Depot: 21.9
- Dividend declared: $1.50
- Dividend yield of The Home Depot: 2.2%
- Diluted shares in issue: 1.073 billion (down -1.5% from 1.094 billion for the same quarter of the previous year)
- Cash and cash equivalents: $14.652 billion
- Cash and equivalents per share: $13.65
- Cash and equivalents makes up 5% of The Home Depot's market capital
- Cash and equivalents makes up 21.8% of The Home Depot's total assets
- Cash and equivalents per share: $13.65
- Merchandise inventories: $16.155 billion
- Inventories makes up 24.1% of Home Depot's total assets
- Receivables: $2.666 billion
- Receivables makes up 3.9% of The Home Depot's total assets
- Cash generated from operations for the 9 months: $17.415 billion
- Cash generated from operations per share for the 9 months: $16.62
Our latest stock valuation of The Home Depot (HD): $204.80
Home Depot Strore Front
More About Lowe's (LOW)
Lowe’s Companies, Inc. (NYSE: LOW) is a FORTUNE® 50 home improvement company serving more than 18 million customers a week in the United States and Canada. With fiscal year 2018 sales of $71.3 billion, Lowe’s and its related businesses operate or service more than 2,200 home improvement and hardware stores and employ approximately 300,000 associates. Founded in 1946 and based in Mooresville, N.C., Lowe’s supports the communities it serves through programs focused on creating safe, affordable housing and helping to develop the next generation of skilled trade experts.
Overview of the latest quarterly earnings report of Lowe's
Our latest stock valuation of Lowe's (LOW): $149.60
Overview of the latest quarterly earnings report of Lowe's
- Net sales $27.302 billion (up from $20.922 billion for the same quarter of the previous year)
- Net sales increased by 30.5% over the last 12 months
- Cost of sales: $17.998 billion (up from $14.252 billion for the same quarter of the previous year)
- Cost of sales increased by 26.3% over the last 12 months
- Net earnings: $2.828 billion (up from $1.676 billion for the same quarter of the previous year)
- Diluted earnings per share: $3.74 (up from $2.14 for the same quarter of the previous year)
- PE ratio of Lowe's (LOW): 14.1
- Cash dividends per share: $ 0.55 (up from $ 0.48 for the same quarter of the previous year)
- Dividend yield: 1.4%
- Diluted number of shares in issue: 753 million (down from 781 million for the same quarter of the previous year)
- Cash and cash equivalents: $11.641 billion
- Cash and cash equivalents per share: $15.46
- Cash and cash equivalents makes up 9.8% of Lowe's market capital
- Cash and cash equivalents makes up 22.4% of Lowe's total assets
- Cash and cash equivalents per share: $15.46
- Merchandise inventory - net: $13.831 billion
- Merchandise inventories increased by 0.74% over the last 12 months
- Merchandise inventories makes up 26.7% of Lowe's total assets
- Total stockholders equity: $4.356 billion
- Stockholders equity per share: $5.78
- Lowe's is trading at 27.3 times its stockholders equity per share, which is well outside the expected range of between 2 and 4 times that most firms tend to trade at
- Stockholders equity per share: $5.78
- Cash generated from operations (for the 3 quarters of their fiscal 2020): $11.752 billion
- Cash generated from operations per share (for the 3 quarters of their fiscal 2020): $15.60
Our latest stock valuation of Lowe's (LOW): $149.60
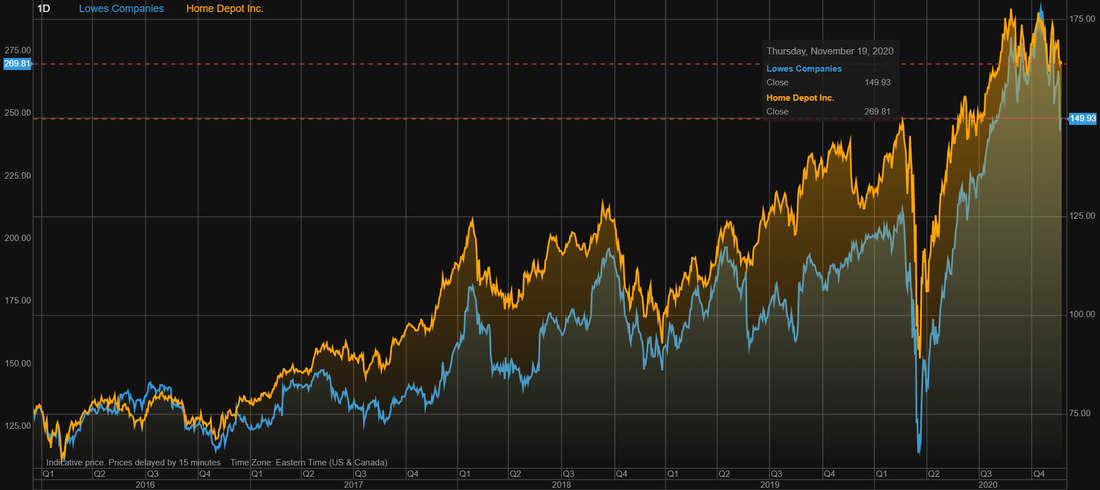
The Home Depot (HD) stock vs Lowe's (LOW) stock over the last 5 years
The image below shows the stock price performance of The Home Depot (HD) and Lowes (LOW) over the last 5 years. And over the 5 year period the stock price trends of the two home improvement giants have been fairly similar. The summary below shows the stock price returns provided by each over the last 5 years, sorted from best to worst performer:
Over the 5 year period the stock of The Home Depot has narrowly outperformed that of its slightly smaller rival, Lowe's
- The Home Depot (HD): 105.4%
- Lowe's (LOW): 94.7%
Over the 5 year period the stock of The Home Depot has narrowly outperformed that of its slightly smaller rival, Lowe's
The Home Depot (HD) stock vs Lowe's (LOW) stock over the last 5 years
Fundamental financial comparison between The Home Depot and Lowe's
So let's take a look at the fundamentals and the valuation metrics in order to determine which of these two firms offers the most value at their current stock price.
One of our key metrics is the Price to Stockholders equity per share ratio. When looking at this we find the following:
Based on this metric Walmart offers far more value than Target Corp. Most firms tend to trade at a ratio of between 2 and 4 times. The higher this ratio the less value a stock offers. A ratio of 6.5 is implying that buying the stock of Target now means you are paying 6.5 times more for the stock than what the stockholders equity per share is worth. But a high stockholders equity per share ratio is still better than a firm that has a stockholders deficit. So what is the stockholders equity per share you ask? Well if a firm sells all assets, pays all its debts ad distributes the rest to its stockholders, the stockholders equity per share shows what each stockholders will get. Thus the higher this ratio the less you will get out per stock compared to what you are paying for it. So for Target at 6.5 times it stockholders equity you will only get 15.38% of its current stock price out of they were to sell all assets, pay all debt and distribute the rest to stockholders. Walmart is slightly better at 20.4% of current stock price
Next up cash as percentage of stock price:
Next up lets take a look at the percentage cash on the balance sheet makes up of each group's total assets:
So based on the cash position of these two firms Lowe’s (LOW) offers more value as their overall cash position compared to their stock price and their overall assets is far greater than that of The Home Depot (HD).
Next up the PE ratio of the stock price:
Price relative to stock valuation
Looking at all the fundamental metrics above Lowe's wins on the Price/Stockholders equity per share metric. Lowe's (LOW) wins when it comes to the cash as percentage of stock price. Lowe's (LOW) also has the stronger cash position with their cash as percentage of total assets being higher than that of The Home Depot (HD). When looking at the PE ratio it is Lowe's once again that wins as it has the lower PE ratio. Lowe's (LOW) is also trading at closer to our latest stock valuation of the group (with it trading at 2.7% above our target price) , while The Home Depot is trading at about 32% above our latest stock valuation (target price) for the group.
Therefore all things considered in the battle between The Home Depot (HD) vs Lowe's (LOW) we rate the stock of Lowe's (LOW) as the very clear winner.
Read the original article here
One of our key metrics is the Price to Stockholders equity per share ratio. When looking at this we find the following:
- Price/Stockholders equity per share for The Home Depot (HD): 4.9
- Price/Stockholders equity per share for Lowe’s (LOW): 6.5
Based on this metric Walmart offers far more value than Target Corp. Most firms tend to trade at a ratio of between 2 and 4 times. The higher this ratio the less value a stock offers. A ratio of 6.5 is implying that buying the stock of Target now means you are paying 6.5 times more for the stock than what the stockholders equity per share is worth. But a high stockholders equity per share ratio is still better than a firm that has a stockholders deficit. So what is the stockholders equity per share you ask? Well if a firm sells all assets, pays all its debts ad distributes the rest to its stockholders, the stockholders equity per share shows what each stockholders will get. Thus the higher this ratio the less you will get out per stock compared to what you are paying for it. So for Target at 6.5 times it stockholders equity you will only get 15.38% of its current stock price out of they were to sell all assets, pay all debt and distribute the rest to stockholders. Walmart is slightly better at 20.4% of current stock price
Next up cash as percentage of stock price:
- Cash as percentage of stock price for The Home Depot (HD): 3.3%
- Cash as percentage of stock price for Lowe’s (LOW) : 6.8%
Next up lets take a look at the percentage cash on the balance sheet makes up of each group's total assets:
- Cash as percentage of stock price for The Home Depot (HD) : 5.7%
- Cash as percentage of stock price for Lowe’s (LOW): 11.8%
So based on the cash position of these two firms Lowe’s (LOW) offers more value as their overall cash position compared to their stock price and their overall assets is far greater than that of The Home Depot (HD).
Next up the PE ratio of the stock price:
- PE ratio for The Home Depot (HD): 20.1
- PE ratio for Lowe’s (LOW) : 21.9
Price relative to stock valuation
- Price/Stock Valuation ratio for The Home Depot (HD): 1.32
- Price/Stock Valuation ratio for Lowe's (LOW): 1.027
Looking at all the fundamental metrics above Lowe's wins on the Price/Stockholders equity per share metric. Lowe's (LOW) wins when it comes to the cash as percentage of stock price. Lowe's (LOW) also has the stronger cash position with their cash as percentage of total assets being higher than that of The Home Depot (HD). When looking at the PE ratio it is Lowe's once again that wins as it has the lower PE ratio. Lowe's (LOW) is also trading at closer to our latest stock valuation of the group (with it trading at 2.7% above our target price) , while The Home Depot is trading at about 32% above our latest stock valuation (target price) for the group.
Therefore all things considered in the battle between The Home Depot (HD) vs Lowe's (LOW) we rate the stock of Lowe's (LOW) as the very clear winner.
Read the original article here