|
Related Topics |
|
We take a look at South Africa's economic complexity using Supply and Use tables published by Statistics South Africa. Basically in this article we try and present how interconnected South Africa's economy is and how various industries in South Africa are dependent on other industries within South Africa.
Supply and Use tables are extremely boring to look at so we have decided to present the numbers in these tables in an interactive way. |

|
Economic complexities shown via a Chord Diagram
So as we mentioned we will be using Supply and Use Tables from 2016 to illustrate just how complex a economic system is, even in a relatively small economy such as South Africa, and just how dependent one sector of the South African economy is on another, to supply critical inputs it needs to manufacture an output that another sector might need. A chord diagram is the best way to link these economic complexities and co dependence of sectors within a economic system. The chord diagram shows a very small number of supply and use dependencies in the South African economy for 2016. The data contained in this graphic barely scratches the surface of the total supply and use tables but it is more than enough to illustrate just how complex the economy is and how various sectors supply and use products from other sectors.
So how does one interpret the chord diagram? We tried to make it as easy as possible to interpret. If a reader scrolls over a specific sector/ industry in the economy it highlights all its possible uses from various industries or which industries it supplies to. If one scroll over a chord it will provide details as to which is the sector supplying and which is the sector using. So lets go to Metal Ores. If one scrolls over Metal Ores it highlights all the chords that either leads to Metal Ores (supplying to this industry) and highlights cords leaving this industry for other industries. For example the thick chord leading from Metal Ores to Exports. Thus the Metal Ores industry supplied goods and services that was used by the Export Industry. So basically Metal Ores being exported (the value of which was R263.9 billion in 2016). Metal Ores also supplied R37.12 billion in goods and services to the Basic Iron and Steel industry.
The image below shows an example of a chord leading from Petroleum products (supplied by Petroleum Products) to Households (so used by Households). Basically fuels and oils produced or supplied by the Petroleum industry in South Africa and used by South African Households.
The image below shows an example of a chord leading from Petroleum products (supplied by Petroleum Products) to Households (so used by Households). Basically fuels and oils produced or supplied by the Petroleum industry in South Africa and used by South African Households.
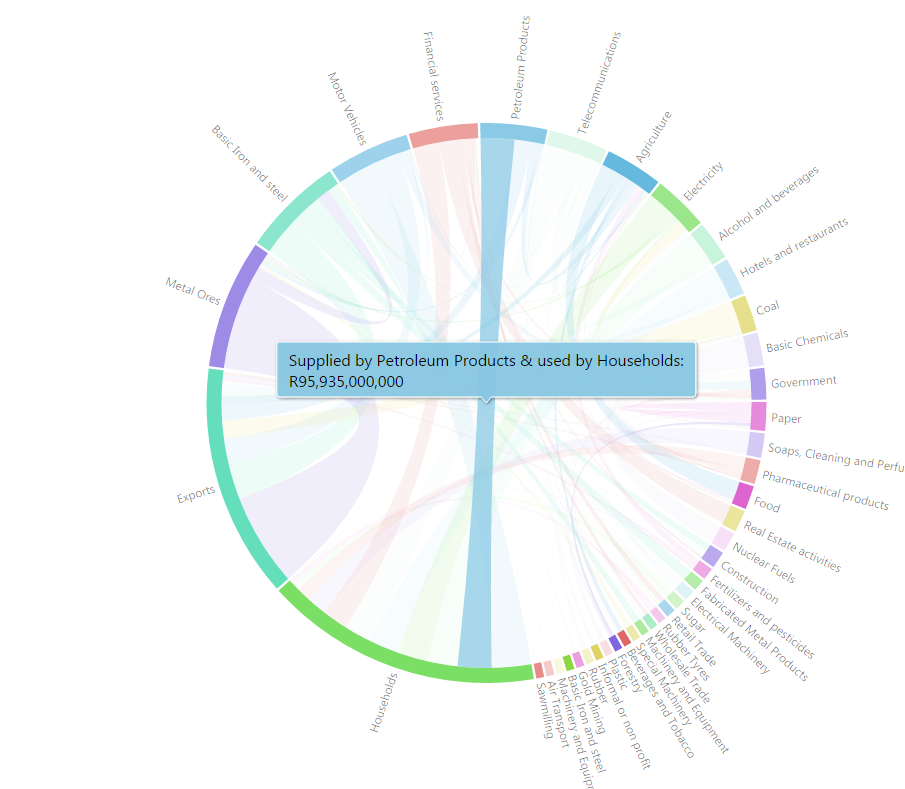
Chord diagram of South Africa's economic complexity and interdependence
Based on the image above on can see that in 2016, Households used R95.9 billion in products supplied by the Petroleum Products industry. And this is how to interpret the graphic above, and keep in mind this is a very small subset of the overall supply and use tables in South Africa. We will look to expand the graphic so that we can continue to provider our readers with ever greater detail regarding the South African economy, its structure and its dependencies. Below a few more supply and uses we thought readers might find interesting:
- Supplied by Coal to Exports: R50.3 billion
- Supplied by Coal to Electricity: R32.1 billion (So in 2016 we exported more coal in terms of value than what we supplied to ESKOM for electricity generation. So whenever ESKOM says there is not enough coal, take it with a pinch of salt as we export more in coal than what we supply ESKOM with).
- Supplied by Electricity to Households: R86.05 billion
- Supplied by Financial Services to Real estate activities: R53.5 billion
- Supplied by Basic Iron and steel to Exports: R104.2 billion
- Supplied by Basic chemicals to Nuclear Fuels: R52.9 billion
- Supplied by Pharmaceutical products to Agriculture: R5.1 billion
- Supplied by Pharmaceutical products to Government: R14.27 billion
- Supplied by Pharmaceutical products to Households: R38.4 billion