|
Related Topics |
|
We take a look at the Stock Exchange News Service (SENS) released by Massmart Holdings in which it provides a sales update, trading statement as well as update on its operating model reorganisation in which its current 4 divisions will be changed into two divisions, namely Massmart retail and Massmart wholesale
|

|
SENS update released by Massmart
SALES UPDATE FOR THE 52 WEEK PERIOD ENDED 29 DECEMBER 2019
For the 52 week period ending 29 December 2019, the Massmart Group recorded total sales growth of 3.0%, which resulted in total sales of R93.7 billion. Comparable store sales increased by 1.5%, while internal sales inflation amounted to 2.5%.
Sales from our SA stores increased by 2.7%, with comparable stores sales increasing by 1.3%. Total sales from our rest of Africa stores measured in Rands increased by 6.4%, which, when measured in constant currencies* increased by 5.5%. On a comparable store basis, our rest of Africa store sales in increased by 2.9% in Rands and 2.1% in constant currencies*.
The second half of 2019 was characterised by tough trading conditions. Economic growth contracted in Q3 2019, whilst Q4 2019 offered little relief. Sales growth for H2 2019 was 0.9% (down from 5.5% in H1 2019) with comparable stores sales contracting by 0.3%.
In addition to the material impact of trading disruptions and customer inconvenience caused by aggressive load-shedding in early December, consumers continued to prioritise spending on non-durables over spending on durable goods. During the course of H2 2019, food sales increased by 3.3%, liquor sales increased by 0.4% while general merchandise sales, our biggest and largest margin category, decreased by 2.6%. Home improvement sales increased by 1.9%.
The Group delivered a very strong Black Friday sales performance resulting in savings to our customers in excess of R300 million. Unfortunately this strong performance did not carry-over into the festive period. Sales growth in Q4 2019 was 0.5% as compared to the same period in 2018. Massdiscounters total sales for the 52 weeks of R19.8 billion was 0.3% up on last year, most notably impacted by lower consumer spending on durable goods. Comparable stores sales contracted by 2.1%. Encouragingly, Game SA saw foot traffic increase by 4% year-on-year.
Masswarehouse recorded total sales of R29.4 billion, which was 2.0% up on last year, with comparable stores sales contracting by 0.3%. While general merchandise sales remained flat on last year, liquor sales grew by 3.5% with food sales growing by 2.5%. Massbuild total sales of R14.2 billion grew by 3.4% as Massbuild continues to maintain its market leading performance in DIY, home maintenance and building supplies.
Comparable store sales increased by 1.4%. The significant slowdown in the construction sector negatively impacted Massbuild, with commercial/ yard sales decreasing by 0.5% compared to last year. This was however more than offset by retail sales growing by 5.3%, as the consumer’s focus shifted to prioritise smaller home improvement and DIY type projects as opposed to major renovations and builds. Masscash total sales of R30.3 billion grew by 5.6%, especially supported by strong wholesale sales growth of 8.6%. Comparable store sales have shown a similar increase. Retail sales are flat on last year, testament of a very competitive market environment.
TRADING STATEMENT FOR THE 52 WEEK PERIOD ENDED 29 DECEMBER 2019
As noted in previous announcements this year, for statutory reporting purposes Massmart has adopted IFRS 16 using the ‘modified retrospective approach’, which does not require that the comparative period be restated.
As referred to in the above sales update, sales growth has continued to be under pressure, especially over the course of H2 2019. Sales pressure was most evident in general merchandise, our biggest category by value and highest contributor to margin. Consequently, the increase in aged stock in this category resulted in additional stock ageing provisions especially at Massdiscounters, while it also negatively impacted our normal and rebate margins. In addition to volume pressures, the higher contribution from food sales and the increase in promotional mix specifically in Game in response to sales pressure, further negatively impacted on gross margin.
Increased focus on expense management and cost savings initiatives in H2 2019 resulted in a slowdown in operating expense growth from 12% in H1 2019 to 6.5% in H2 2019 with full year operating expense growth of 9.4%. Expense growth however still outpaced sales growth. Consequently, trading profit, for the full year, before the impact of IFRS 16, is expected to be 73.0% to 83.0% lower than the prior year trading profit of R2,068.9 million. Including the impact of IFRS 16, trading profit is expected to be 40% to 50% lower than the prior year trading profit of R2,068.9 million.
Driven by the overall lower profitability, the reversal of certain deferred tax assets in the rest of Africa and locally as well as the limitation of raising further assets relating to current year tax losses in certain operations, the effective tax rate is expected to be negatively impacted. The lower operating performance, albeit somewhat offset by improved working capital management and lower capital expenditure, resulted in an increase in net borrowings compared to last year. This increase resulted in an increase of approximately 11% in the cost of borrowings.
Shareholders are referred to the Sens announcement on 13 January 2020 regarding the potential closure of 34 Dion Wired and Masscash stores. The continued loss making nature of these stores were identified as a trigger for testing for potential impairment at the end of the 2019 financial year, resulting in the impairment of certain of the fixtures and fittings, inventory and right-of-use lease assets of these stores.
The value of this impairment will be confirmed with the release of our preliminary results for the 52 weeks ending 29 December 2019 and is expected to be in the region of R200 – R250 million, before tax. Consequently shareholders are advised that Massmart expects, with reasonable certainty, the following financial results: Excluding the impact of adopting IFRS 16:
Expected Pro-forma Dec 2019 Reported Dec 2018 Expected % change
Headline (loss)/ earnings (Rm) (746.4) to (836.6) 901.2 (183%) to (193%)
HEPS (cents) (342.9) to (384.5) 416.5 (182%) to (192%)
Net (loss)/ earnings (Rm) (862.6) to (951.4) 888.6 (197%) to (207%)
Basic EPS (cents) (396.2) to (437.3) 410.6 (197%) to (207%)
Including the impact of adopting IFRS 16:
Expected Pro-forma Dec 2019 Reported Dec 2018 Expected % change
Headline (loss)/ earnings (1,136.6) to (1,226.7) 901.2 (226%) to (236%)
HEPS (cents) (522.1) to (563.7) 416.5 (225%) to (235%)
Net (loss)/ earnings (Rm) (1,296.8) to (1,385.6) 888.6 (246%) to (256%)
Basic EPS (cents) (595.7) to (636.7) 410.6 (245%) to (255%)
Massmart’s financial results for the 52 weeks to December 2019 will be released on the Stock Exchange News Service of the JSE Limited on 27 February 2020. The information above has not been audited or reviewed or otherwise reported on by the Company’s external auditors.
INVESTOR DAY PRESENTATION
Stakeholders are herewith advised that today Massmart is hosting members of the investment community for a business update. The briefing will include a presentation by CEO, Mr Mitchell Slape and members of the Executive. A presentation, which will form the basis of this briefing, is available on the Company's website https://www.massmart.co.za/

Marko, one of Massmarts biggest assets
REORGANISATION OF MASSMART’S OPERATING MODEL
Following a review of Massmart’s Retail and Wholesale routes to market, and the associated rationalisation of the Group, Massmart announces a re-organisation of its current operating model. The following changes are effective from 1 February 2020: Re-organisation of four divisions into two business units
The four divisions, namely: Masscash (incorporating the Jumbo; Cambridge Food; Rhino Cash & Carry; Liquorland; Jumbo Shield and Saverite brands); Masswarehouse (incorporating the Makro and Fruitspot brands); Massbuild (incorporating the Builders Warehouse; Builders Express; Builders Trade Depot and Builders Superstore brands) and Massdiscounters (incorporating the Game and Dion-Wired brands) shall, effective 1 February 2020, be reconstituted into two business units. These being Massmart Wholesale and Massmart Retail.
• Massmart Retail will comprise of the Builders, Game Dion-Wired and Cambridge Food trading brands. Mr Llewellyn Walters, the current Builders Chief Executive, is appointed as the Chief Executive of Massmart Retail.
• Massmart Wholesale will comprise of the Makro, Shield and the Group’s Wholesale Cash & Carry trading brands.
Mr Doug Jones, the current Makro Chief Executive, is appointed as the Chief Executive of Massmart Wholesale. Streamlining of certain support structures The business units will be supported by centrally managed Finance, Supply Chain and Information Technology transaction hubs and centres of excellence. The existing divisional Finance, Supply Chain and Information Technology functions will report centrally as follows:
• The divisional Finance functions will report to Mr Mohammed Abdool-Samad, Massmart’s Chief Financial Officer.
• The divisional Information Technology and Divisional Supply Chain functions will report to Mr Richard Inskip, Massmart’s Chief Operating Officer.
The anticipated benefits of the re-organisation include: unlocking trading brand synergies; delivering bespoke retail and wholesale customer focus, driving market agility and effective execution, leveraging Group-wide procurement scale and harmonising Group-wide functional practice in line with best retail practises.
Massmart stock price history
The image below shows the share price history of Massmart over the last 5 years. And its not been a very good time for Massmart shareholders with the stock having lost 69.60% of its value over the last 5 years. So shareholders would be hoping its optimization plan and the reorganisation of the group will stem the share price losses of the last couple of years.
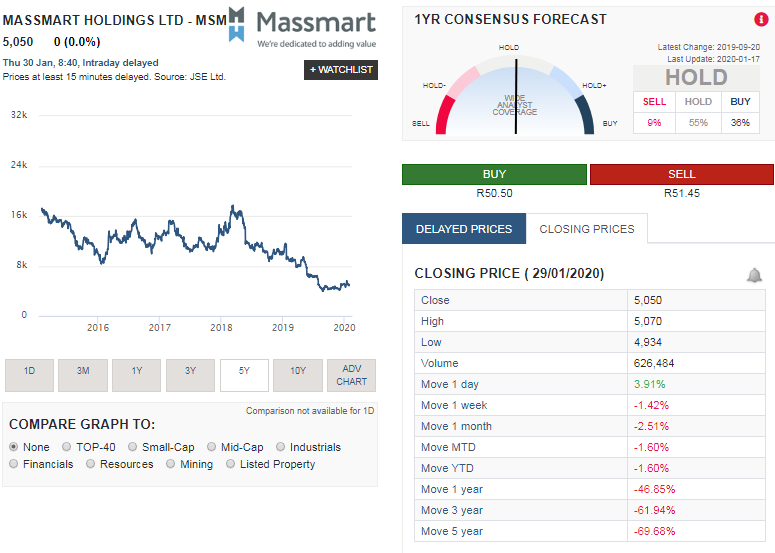
Massmart stock price history over the last 5 years tells a pretty depressing story
The summary below shows the returns provided to Massmart shareholders over various time periods:
- 1 week: -1.42%
- 1 month: -2.51%
- 1 year: -48.85%
- 3 years: -61.94%
- 5 years: -69.60%