|
Related Topics |
|
We take a look at the latest electricity generated an available for distribution as published by Statistics South Africa for the month of April 2020, the month in which South Africa was under Level 5 lockdown. What did electricity generation and usage look like during the Level 5 lockdown period.
|
|
Executive summary of electricity generaetd and available for distribution
Electricity generation (production) decreased by 22,8% year-on-year in April 2020. Seasonally adjusted electricity generation decreased by 16,6% in April 2020 compared with March 2020. This followed month-on-month changes of -2,1% in March 2020 and -0,2% in February 2020. Seasonally adjusted electricity generation decreased by 6,7% in the three months ended April 2020 compared with the previous three months.
Electricity distribution (consumption) decreased by 23,3% year-on-year in April 2020. Seasonally adjusted electricity distribution decreased by 16,6% month-on-month in April 2020, following month-on-month changes of -2,3% in March 2020 and -1,1% in February 2020. Seasonally adjusted electricity distribution decreased by 7,6% in the three months ended April 2020 compared with the previous three months.
The summary below shows the year on year growth in gigawatt-hours delivered to the various provinces in South Africa
- Western Cape: -21,0%
- Eastern Cape: -19,4%
- Northern Cape: -23,3%
- Free State : -5,0%
- KwaZulu-Natal : -17,0%
- North West : -65,2%
- Gauteng: -16,0%
- Mpumalanga : -22,5%
- Limpopo: -2,9%
- Total : -23,0%
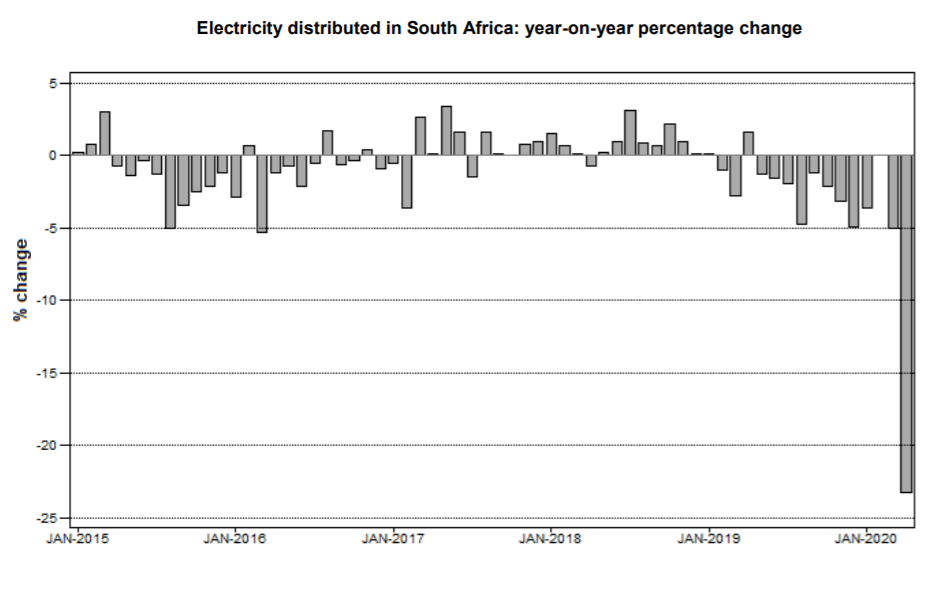
The image above shows the year on year change in the electricity distribution in South Africa over the last couple of years. It is clear that there was a lot less electricity used during the Level 5 lockdown in April 2020. Readers would have noted the significant decline in the electricity usage of the North West province during this period. This is largely due to the closure of mine, in particular platinum mines during this period. As mines are by far the biggest consumers of electricity in the province of the North West.