|
Related Topics |
|
In today's blog we take a look at South African retail giant Woolworths's latest trading update. And the numbers (especially those in Australia does not inspire confidence for Woolworths (WHL) share holders.
We take a look at WHL share price on two interactive charts. The one shows WHL share price on a interactive candlestick chart (in which users can set the date range and the graph recalculates the return based on selected range), users can also change the colours of the chart, download the graph as an image or download the actual data used to draw the graphics. The other graphic is a line graph with vast technical analysis functions |
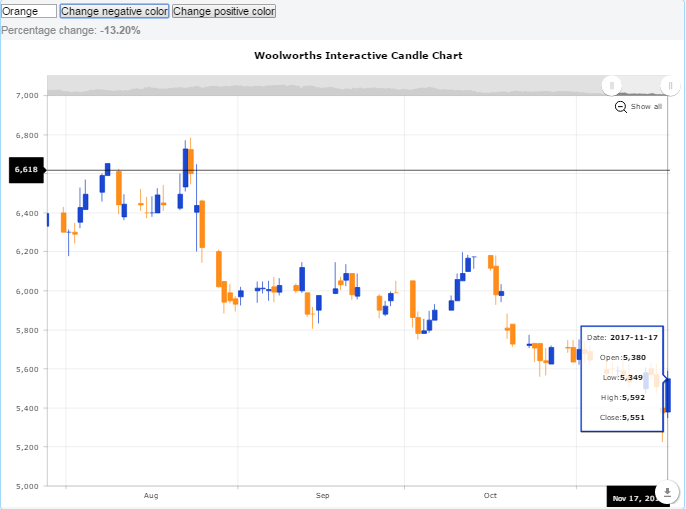
WHL candle stick chart
|
Trading update
So what did WHL's trading update look like? Below the SENS announcement as released by WHL:
TRADING UPDATE: 20 WEEKS ENDED 12 NOVEMBER 2017
Group sales for the first 20 weeks of the 2018 financial year increased by 2.6% (3.1% in constant currency terms) compared to the prior period. The difficult trading conditions experienced in both South Africa and Australia during the last quarter of the previous financial year have continued into
the current period.
In South Africa, Woolworths Fashion, Beauty and Home (previously Clothing and General Merchandise) sales increased by 0.7%, with price movement of 0.9%. Sales in comparable stores declined by 2.4%. Trade was affected by the macro environment, which negatively impacted consumer sentiment and discretionary spend. Retail space grew by a net 4.2%.
Woolworths Food sales in South Africa grew ahead of the market, up 9.3%, with price movement of 4.5% and positive volume growth. Sales in comparable stores grew by 5.3%, driven by price investment and our ongoing focus on product quality and innovation. Retail space grew by a net 8.2%.
David Jones sales declined by 5.3% and by 5.2% in comparable stores (in Australian dollar terms). Sales growth was impacted, but gross margin was protected, by the pull-forward of the end of season winter sale into late June and a reduction in promotional activity throughout the period. Key concession brands also reduced tactical campaign activity in David Jones to reduce discounting. Disruption caused by the refurbishments of the Bondi Junction Food Hall and the Elizabeth Street store, as well as from the implementation of the new inventory management system also impacted trade. Sales in the last six weeks have shown an improving trend. Retail space reduced by a net 2.2% as we continue to drive space optimisation.
Country Road Group sales increased by 8.3% in Australian dollar terms. Sales in comparable stores (which excludes Politix stores acquired in November 2016) declined by 0.4%, although market share has improved. Trading space reduced by a net 2.0% during the period (excluding Politix). We opened eight new Politix locations within David Jones stores and are seeing positive results from this initiative.
The Woolworths Financial Services debtors’ book reflected positive year-on-year growth of 4.8% at the end of October 2017, with strong growth in the credit card portfolio. The annualised impairment rate for the four months ended 31 October 2017 reduced to 5.7% from 6.4% in 2017. The Group’s interim results for the 26-week period ended 24 December 2017 are scheduled to be announced on the Stock Exchange News Service on or about 22 February 2018
Below the candlestick chart showing WHL share price for the last 4 years.
Percent change: