|
Related Topics |
|
While we have looked at South Africa's government revenue sources in detail and we have discussed South Africa's tax system at length, we haven't really looked at where the major personal income tax (PIT) payers are based. Based on a question of one of our readers, we decided to do some digging and look at where major PIT payers are based.
|
Where are the major Personal Income Tax payers based?
The map below shows the results of the average taxes paid per registered tax payer per municipality as reported by South African Revenue Service (SARS). One or two of the municipalities on the higher end of the scale might surprise our readers, as it sure surprised us.
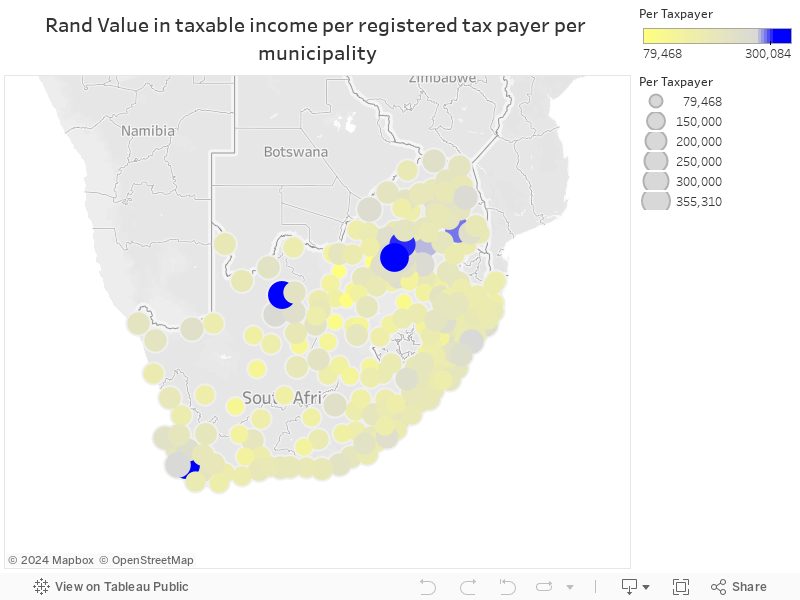
First thing that caught our eye was the fact that the average registered tax payer in Stellenbosch pays more in PIT than that of City of Cape Town. Evidence that the "Stellenbosch mafia" is making heaps of money and therefore pay significant taxes. Even more surprising is the fac that Gamagara Local Municipality has the 3rd highest recorded taxes paid per tax payer in the whole of South Africa, beating far more affluent areas such as City of Tshwane, City of Cape Town, Ethekweni (Durban) etc. According to SARS's data there were 5 180 registered tax payers in this municipality with taxable income of R1.63billion. While the taxable income is not very high, the fact that there is such a small number of registered tax payers makes the average taxable income per person very high. This suggests that there are a few very wealthy individuals in this municipality.
Another interesting find is Thaba Chweu local municipality where the average taxable income per registered tax payer in the municipality amounted to R281 600 odd (ranking it 7th highest average taxable income per person) out of all the municipalities in South Africa. Beating municipalities such as Ekurhuleni and Emalahleni. Again this is largely due to the small number of tax payers registered in this municipality (just over 8 000 registered tax payers).
Looking at these results a little differently we get the following horizontal bar chart showing the top 50 municipalites based on average taxable income per municipality per person.
Looking at these results a little differently we get the following horizontal bar chart showing the top 50 municipalites based on average taxable income per municipality per person.
Next we will draw the same map, but instead of looking at the average taxable income per registered tax payer per municipality we will take a look at the overall taxable income per municipality. And this should paint a very different picture regarding where PIT money is coming from. As a lot of the large contributors to the tax pool has a large number of citizens (and therefore did not feature to highly on the first map as it took the average rate of taxes per tax payers). The map below shows the contribution of each municipality to total personal income tax.

From the map above it is clear that the majority of South Africa's PIT comes from Gauteng, in particular City of Joburg and City of Tshwane municipalities. With the City of Cape Town contributing significantly to the tax coffers too. Ethekweni the only significant contributing municipality outside those located in Gauteng or Western Cape. Buffulo City (East London) , Nelson Mandela Bay (PE) and Manguang (Bloemfontein) all contributing similar amounts to the state coffers.
Readers will notice Northern Cape and Mpumalanga hardly features on this map, even though some of their municipalities featured highly in the first interactive map.
Readers will notice Northern Cape and Mpumalanga hardly features on this map, even though some of their municipalities featured highly in the first interactive map.
Looking at this Gauteng citizens would feel aggrieved to know that a large part of their tax money is spent in other provinces as government redistributes a lot of tax money obtained in Gauteng to other provinces across the country to ensure service delivery in areas where tax money might not be as forthcoming.
During the E-tolls debate there were arguments put into public that those living in other provinces do not want to pay to improve Gauteng's roads (they would pay via in increased fuel levy for everyone in the country). That argument is extremely weak though, as the majority of services delivered by government in South Africa is paid out of the tax money supplied by residents in Gauteng.
During the E-tolls debate there were arguments put into public that those living in other provinces do not want to pay to improve Gauteng's roads (they would pay via in increased fuel levy for everyone in the country). That argument is extremely weak though, as the majority of services delivered by government in South Africa is paid out of the tax money supplied by residents in Gauteng.
The table below shows the Top 10 municipalities and their relative contribution to total taxable income in South Africa. The 10 biggest municipalities makes up around 68% of all total taxable personal income tax. Just showing how dependend the government revenue obtained from PIT is on the bigger municipalities (and in particular those in Gauteng). Next time government looks to milk the Gauteng tax payers (as they are trying to do with E-tolls), perhaps they should take a look at the table below and find other ways in which to fund their spending, as the Gautengers are clearly contributing their fair share in terms of PIT.
Municipality |
Contribution to total taxable PIT |
City of Joburg |
18.5% |
City of Cape Town |
12.3% |
City of Tshwane |
11.1% |
Ekurhuleni |
9.7% |
Ethekwini (Durban) |
7.4% |
Nelson Mandela Bay (PE) |
2.6% |
Buffalo City (East London) |
1.7% |
Mangaung (Bloemfontein) |
1.7% |
Emfuleni (Vaal) |
1.6% |
Rustenburg |
1.3% |