|
Related Topics |
|
In today's blog we take a look at South Africa's fiscal policy in more detail. Essentially fiscal policy refers to a particular government's budget. In our case, we will take a look at the South African government's budget. That is, its income, its expenditure and its borrowings.
|
|
So what does South Africa's fiscal policy stance look like over time?
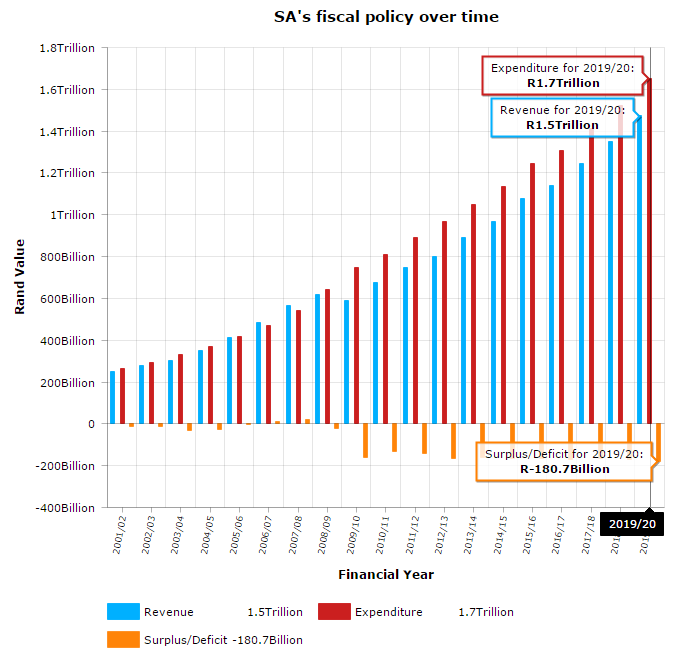
The interactive graphic below shows South Africa's Total Revenue, Total Expenditure and budget balance per financial year from the year 2000/2001 up until the predicted values for 2019/2020.
The graphic above shows how both government revenues and government expenditure has increased over time (however a large part of that is due to inflation). They worrying number for South Africans should be the Surplus/Deficit number which shows that it is getting worse over time. Essentially government spending is growing faster than the revenue that it is collecting. Now the only way to finance such a shortfall is to take on debt. But with increased debt comes increased debt servicing costs, which means more and more money is spent by government to pay off debt instead of providing services to the citizens of this country.
While we understand the need to increase spending to serve the ever increasing needs of the people, continued reckless spending by that state, will lead to lenders soon starting to dry up as concerns regarding governments ability to pay back it's debt starts increasing. With sluggish economic growth in South Africa leading to South African Revenue Service (SARS) missing it's revenue collection targets less money is making it to state coffers than expected. Lower corporate taxes, and less personal income tax all placing a drag on money coming in for government. Political uncertainty and wildly regressive ideas and policies being set by government (think mining charter) is scaring off potential investors in the country, leading to depressed development and growth in South Africa.
All of the above has lead to two of the three ratings agencies (S&P and Fitch) rating South Africa's debt as "junk status" or sub investment grade. And with Minster Gigaba's "mini budget" spooking investors, it is now basically a given that Moody's will join their peers in the industry and rate South Africa as "junk status" for the first time in South Africa's democracy.
All these downgrades pushes up interest rates that government has to pay on the debt it is making, as investors require additional compensation for the risk they are taking by providing debt to "sub investment grade" countries. And as mentioned earlier, as debt servicing costs rises, more and more money is channeled towards paying off debt instead of paying for goods and services being provided to South Africans
The graphic below shows the debt-service cost as a percentage of South Africa's GDP. That is basically what is the amount spent by government on paying off it's debt as a percentage of South Africa's total economy. While the current debt servicing costs are expected to increase as shown by the estimates for the 2018/19 and 2019/20 values, it is lower than levels of debt servicing costs South Africa endured in the past. So why the big issue now?
Well the major concern now is the fact that South Africa's economy is growing at rates FAR slower than it did in 2002-2004. So back then, strong economic growth ensured the ratio of debt servicing costs to GDP remained in check. Strong growth also ensured revenue collection targets were met. Now the story is totally different. The economy is barely growing. If we take the growth of the population into account, the economy is growing slower than the population, which basically means the slice of South Africa's economic pie per person in the country is getting smaller and smaller. Thus the overall welfare of South African citizens are declining.
Government has implemented an expansionary fiscal policy for years and years and years (that is spending more and more and more), yet the quality of services have not improved. The thousands of riots and protests across South Africa can attest to this. And government's continued expansionary fiscal policy has hardly had the desired effect of stimulating demand in the local economy. Part of the reason for this is the fact that monetary policy (as set by the South African Reserve Bank) has been contractionary in nature, by the fact that interest rates have been increased numerous time over the last couple of years, taking cash away from consumers, which dampens consumers spending. This creates the opposite effect to stimulating growth that government was hoping for with expansionary fiscal policy. See our South Africa's Monetary Fiscal Policy Mix for more.
15 November 2017: Update
Just after writing this article news was released about a bond placement by National Treasury. The following was published in Biznews.com website regarding this. Article can be found here: Biznews
At yesterday’s weekly auction, global bond investors offered to lend three times the R3.3bn which the South African Treasury was looking for. But SA had to pay 75 basis points (0.75%) higher interest than two months back. What is usually a low key affair was closely watched as it was the first time since Treasury increased its weekly tender by R650m (from R2.65bn). SA needs the additional funding to close a three year gap now projected at R122bn. Since spendthrift Zuma took office, SA’s debt to GDP ratio has doubled from 28%, with interest costs rising in proportion. This higher rate adds R25m a year to the interest bill on the weekly sale of debt. As the bonds run from between 14 and 31 years to maturity, SA is now paying R350m more interest at its weekly auction because of higher rates demanded by investors. There is some good news, though. At these interest rates the market has priced in the impact of a downgrade to junk when Moody’s and S&P review their ratings next Friday. And although traders expect junk to be confirmed, they are also signalling the end of Zumanomics is nigh. Let’s hope they’re right.
Now the higher interest rate paid is adding R25mil to this bond auction alone. And as we mentioned earlier the higher the interest rate the more money is being spent to service debt instead of being available to fund goods and service delivery to the people of South Africa
Let us know what you thought of this article: |