|
Related Topics |
|
We take a look at the third quarter earnings report from Macy Inc, on of the leading premium retailers in the United States, with almost 130 000 employees and close to 900 stores and operating in 44 states in the US as well as in Dubai and Kuwait
|

|
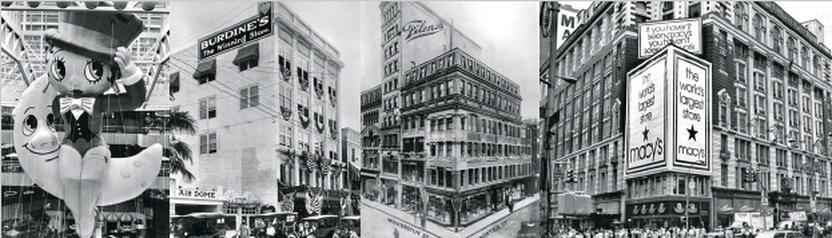
About Macy's
The following information regarding Macy's was obtained from their website as well as their annual reports
Macy's, Inc. is one of the nation's premier retailers. With fiscal 2017 sales of $24.837 billion and approximately 130,000 employees, the company operates approximately 690 department stores under the nameplates Macy's and Bloomingdale's, and more than 170 specialty stores that include Bloomingdale's The Outlet, Bluemercury, Macy's Backstage and STORY. Macy's, Inc. operates stores in 44 states, the District of Columbia, Guam and Puerto Rico, as well as macys.com, bloomingdales.com and bluemercury.com. Bloomingdale's stores in Dubai and Kuwait are operated by Al Tayer Group LLC under license agreements. Macy's, Inc. has corporate offices in Cincinnati, Ohio, and New York, New York.
Macy’s, the largest retail brand of Macy’s, Inc., serves customers through about 670 stores, online at macys.com and through the Macy’s shopping app for mobile devices. Established in 1858, Macy’s is an iconic brand, delivering fashion and affordable luxury through powerful assortments of the best brands. Clearly, Macy’s is distinctly different from other major retailers. Our experience transcends ordinary shopping with special events and unforgettable experiences, including the Macy’s Thanksgiving Day Parade and holiday traditions; engaging customer service; and giving programs that make a difference in our communities. It’s all part of the excitement we’ve been creating for 158 years.
Bloomingdale’s is America’s only nationwide, full-line, upscale department store and is widely recognized for its originality, innovation and fashion leadership. It is a contemporary and “of-the-moment” brand with an omnichannel approach focused on providing a seamless customer experience from in-store to online. Bloomingdale’s is truly “Like no other store in the world” (the brand’s famous tagline), and is a leading attraction for domestic and international tourists. The brand operates 38 stores, bloomingdales.com and 17 Bloomingdale’s The Outlet locations. Bloomingdale’s stores in Dubai and Kuwait are operated under license agreements with Al Tayer Insignia, a company of Al Tayer Group LLC.
Bluemercury was founded in 1999 and is widely recognized as the largest and fastest-growing luxury beauty and spa retail chain in the nation. Bluemercury joined Macy’s, Inc. through acquisition in March 2015. This high-growth luxury brand now boasts more than 124 specialty stores, including 19 stores within Macy’s, in 22 states nationwide. Bluemercury is the go-to destination for all of its clients’ luxury beauty needs
Macy's day parade
So to the numbers we go
- Net sales: $ 5.4billion (up 2.3% from $5.28 billion in the prior year)
- Credit card revenues: $185 million (up 3.4% from $145 million in the prior year)
- Cost of sales: $3.226 billion (up 2.3% from $3.152 billion in the prior year)
- Net income: $62 million (up 206% from $30 million in the prior year)
- Diluted earnings per share: $0.20 (up 100% from $0.10 in the prior year)
- Net profit margin of 1.15%
- Cash and equivalents: $736 million (or $2.36 a share)
- Net income from operating activities: $358 million (or $1.15 a share)
- Inventories at $7.147 billion (up only 1.16% on the prior year)
- Receivables: $180 million (down from $219 million in the prior period)
So any comments or guidance from management on the results?
The group released the following commentary with their 3rd quarter earnings report.
- Comparable sales growth of 3.1% on an owned basis; 3.3% on an owned plus licensed basis
- Higher sales and earnings driven by strong digital, continued improvement from brick & mortar and execution of the North Star Strategy
- Company updates annual guidance, including 15 cent increase in earnings per share
- Strategic initiatives put company on track to deliver strong holiday season and fourth quarter
"We are pleased with Macy’s, Inc. performance in the third quarter, marking our fourth consecutive quarter of comparable sales growth. Macy’s, Bloomingdale’s and Bluemercury all performed well. Our strategic initiatives are gaining momentum and delivering results. Another double-digit quarter from our digital business and a strong stores performance combined to help us exceed expectations. We continue to see an improved trend in brick and mortar across the fleet with particularly strong results from our Growth50 stores,” said Jeff Gennette, Macy's, Inc. chairman and chief executive officer. “The holiday season is when Macy’s truly shines. We have the right merchandise, the right marketing and the right customer experiences in place to deliver a strong fourth quarter."
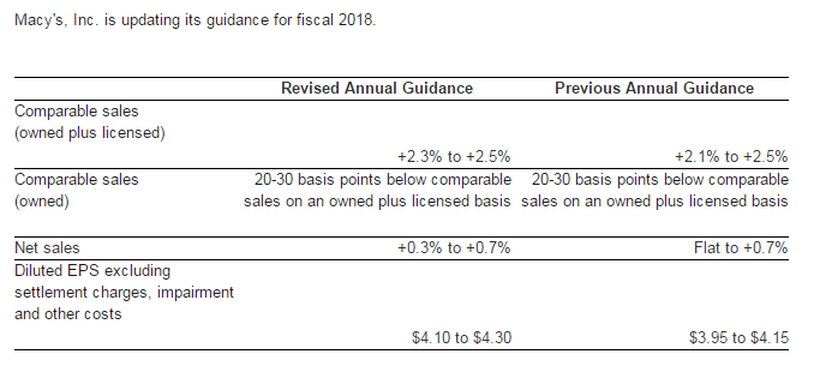
The image below provides an updated guidance provided by the company of the the expected full year outlook for 2018.
The image below provides an updated guidance provided by the company of the the expected full year outlook for 2018.
So should you buy their shares?
Well with paper thin net profit margins, no dividend to speak off it doesn't stand out as a screaming buy at this point. With their expected earnings per share for the full year being close to $1.60 it places the group at a pretty stiff PE ratio of 23.6. Which is well above the market average. And for a company with no dividends being paid to lure investors, no real barriers to entry to enter the market they operate in one has to wonder why it is trading at the price its trading. Perhaps investors are predicting a bumper holiday season for the group.
Their Net Asset Value is just over $18. So currently it is trading at more than double its book value. For a retailer with such thin net profit margins to trade at double its net asset value, signals to us that it is over priced.
Their Net Asset Value is just over $18. So currently it is trading at more than double its book value. For a retailer with such thin net profit margins to trade at double its net asset value, signals to us that it is over priced.
Macy's stock valuation
Based on the quarterly earnings presented, the revised forecast, their balance sheet and cash position we value the group at $34.70. So basically at the current price we believe the group is a little overvalued and would advise investors not to invest in the company at their current market price. While the holiday season might be their cash cow, we priced in a very good holiday period into our valuation of $34.70 and this still gets us to a value well below the current share price level. While other might like the stock at this price, we dont and we wont recommend buying it at current levels. Investors should look to buy it at at least 10% less than our valuation level. So around the $30 a share mark, to limit potential down side.