South African Market Insights
  • Home
  • Blog
    • Blog-5Jun2018
    • Blog-18May2018
    • Blog-16May2018
    • Blog-3May2018
    • Blog-2May2018
    • Blog-30Apr2018
    • Blog-26Apr2018
    • Blog-24Apr2018
    • Blog-18Apr2018
    • Blog-17Apr2018
    • Blog-16Apr2018
    • Blog-3Apr2018
    • Blog-22Mar2018
    • Blog-20Mar2018
    • Blog-19Mar2018
    • Blog-23Oct2017
    • Blog-20Oct2017
    • Blog-11Oct2017
    • Blog-10Oct2017
    • Blog-6Oct2017
    • Blog-3Oct2017
    • Blog-2Oct2017
  • Economics
    • Rand Dollar Exchange Rate
    • South Africa's GDP
    • South Africa's Unemployment
    • SA by numbers
    • Economic Progress Index
    • Taylors Rule
    • South Africa's Formal Business Sector
    • South-Africa's-Fiscal-Policy
    • SA EU Trade Data
    • Inflation Heat Map
    • Population Density Map
    • Labour Market Dynamics
    • Estimating the Size of the Informal Economy
    • SA Consumer Spending Patterns
    • South Africa's Monetary Fiscal Policy Mix
    • GDP Animations >
      • SouthAfrica
      • WesternCape
      • EasternCape
      • NorthernCape
      • FreeState
      • KwaZuluNatal
      • NorthWest
      • Gauteng
      • Mpumalanga
      • Limpopo
    • South Africa's Economic Structure
    • South Africa's Economic History
    • South Africa's Trade Data Page
    • South Africa's Food and Beverages Sector
    • Financial Well-being of South African Companies_2015
    • SA vs the World
    • Budget Day Page (24 Feb 2016)
  • Stock in Focus
    • JSE ALSI Chart
    • Sector Comparison Page
    • JSE-Calendar-Tracker-2019
    • Adcorp (ADR)
    • Amazon (AMZN)
    • Apple (AAPL)
    • Ascendis (ASC)
    • AVI (AVI)
    • Bidvest (BVT)
    • Blue Label Telecoms (BLU)
    • Bowler Metcalf (BCF)
    • Capitec (CPI)
    • City Lodge Hotel Group
    • Clicks Group (CLS)
    • Coronation (CML)
    • Curro Holdings (COH)
    • Discovery (DSY)
    • Distell (DST)
    • EOH (EOH)
    • Famous Brands (FBR)
    • Ferrari (RACE)
    • FirstRand Group (FSR)
    • Grindrod (GND)
    • GrowthPoint (GRT)
    • Holdsport (HSP)
    • Harley-Davidson (HOG)
    • Hyprop (HYP)
    • Hyprop (HYP)_1Jun2016
    • Investec Property Fund (IPF)
    • JSE (JSE)
    • Massmart (MSM)
    • MediClinic (MEI)
    • MTN (MTN)
    • MTN (MTN)_May2016
    • Mr Price Group (MRP)
    • Mr Price Group (MRP)_8APR2016
    • Nedbank (NED)
    • OneLogix (OLG)
    • Peregrine Holdings (PGR)
    • Pick 'n Pay Stores (PIK)
    • Pioneer Foods (PFG)
    • PSG Group (PSG)
    • Quantum Foods (QFH)
    • RCL Foods (RCL)
    • Remgro (REM)
    • Richemont (CFR)
    • RMB Holdings (RMH)
    • Rolfes (RLF)
    • Sanlam (SLM)
    • Sasol (SOL)
    • Sasol (SOL)_18sep2016
    • Santova (SNV)
    • Spar Group (SPP)
    • Shoprite Holdings (SHP)
    • Spur Corporation (SUR)_7Sep2017
    • Standard Bank (SBK)
    • Steinhoff International Holdings (SNH)
    • Stor-Age (SSS)
    • Super Group (SPG)
    • Taste Holdings (TAS)_30May2016
    • The Foshini Group (TFG)
    • Value Logistics (VLE)
    • Vodacom (VOD)
    • Wilson Bayly Holmes Ovcon (WBO)
    • Woolworths (WHL)
    • Woolworths (WHL)_24Aug2017
    • Zeder (ZED)
  • Online Calculators
    • Rand Petrol Price Estimator
    • Share Valuation
    • Financial Ratios Calculator
    • GDP Growth Estimator
    • Future Value of Investment Calculator
    • Loan repayment calculator
  • Contact
  • About
  • Search

< Steinhoff
SuperGroup  >

Woolworths (WHL) will be the stock in focus: (Price at time of writing: R66.03 as 24 August 2017)
Picture

Related Topics

  • Shoprite
  • Mr Price
  • Spar
  • Pick 'n Pay
  • ​Woolies Feb 2016​

chart created with amCharts | amCharts

Background and overview of Woolworths( WHL)
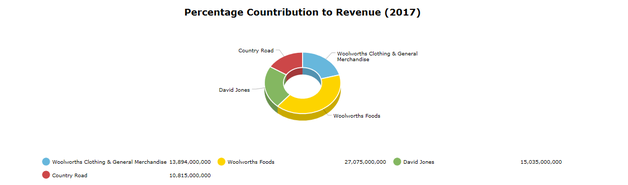
Woolworths Holdings Limited (WHL) is a South African-based retail group listed on the Johannesburg Stock Exchange since 1997. 

The WHL Group consists of three main operating companies, Woolworths Proprietary Limited (Woolworths), David Jones Limited (David Jones) and Country Road Limited (Country Road Group). Woolworths Financial Services (Proprietary) Limited (Woolworths Financial Services) is a joint venture with Barclays Africa Group. See 
http://www.woolworthsholdings.co.za/

WHL's share price has taken an absolute pounding in the recent past and investors must be worrying if this trend will ever stop. See the graphic below for WHL's share price. Also see our Sector Comparison page where we compare the share price over time of WHL with other retailers such as Shoprite, Massmart etc.

The interactive chart below shows WHL's share price for the last number of years. Adjust the data and the chart recalculates WHL's share price movement, change the negative and positive candle colours, download the graphic or the data.

Percent change:

 Woolworths operates in a very congested market. They have competition on the food side from Spar, Pick 'n Pay, Shoprite, and on the clothing front from The Foshini Group and Mr Price. Their net profit margins are however superior to most of these retailers, offering a compelling value investment case before even digging any deeper into their financial results (which we do below). 

WHL Technical Analysis chart

The graphic below shows WHL share price on our new interactive technical analysis chart. It shows WHL share price history for the last 4 years and offers various technical analysis options to apply to the share price data.
When looking at the EMA10 and EMA30 (for only 2017 data), the EMA10 has crossed above the EMA30 which is usually a positive sign for the share price trend over the short term. WHL shareholders might see a uptick in WHL price in the short term.

​Scroll over or click on the funnel chart to get more details of WHL's latest financial results (year ending June 2017)
funnel | amCharts

Financial review: 
WHL is sitting on a net profit margin of close to 7.84%. Which considering the amount of competition WHL faces in the market both in South Africa and Australia that is not a bad performance.  (although it has to be noted in its last valuation WHL sat with a profit margin of over 9%). And while it is far superior margins than those achieved by larger retail chains such as Shoprite where the net profit margins are paper thin it is in the decline, showing the difficult operating environment.

Diluted headline earnings per share (HEPS) for the full year came in at R4.18 a share, placing WHL on a PE ratio of 15.8 (which when one compares it to the overall JSE levels of around 20), is not that demanding at all. In fact it is a extremely low PE ratio for a high quality company. Value investors are sure to be pilling into this one at current prices.  The full year dividend announced by WHL is kept at R3.13 placing them on a strong 4.74% dividend yield.
Cash generated from operations amounted to R7.562billion (or R7.86 per share) for the period.  This is lower than the cash generated per share for their previous set of financial results. Due to more shares in issue and less cash generated by the business in total. Total cash and equivalents on their books is sitting at a worryingly low R1.78billion (or R1.85 a share). Both of these indicators show that woolies is pretty cash flush and potential investors should not be to concerned about their cash position (even if the share price shows that there are investor concerns regarding WHL and it's future profit potential.

A key variable to look at when it comes to the retailers (in particular those ones active in the clothing segment) is the level of inventories. Are the goods at the shop moving fast enough, or are the inventories starting to stack up. Increasing inventories usually show that stock is moving slower (or the business is bolstering up in expectation of increased demand).

WHL inventories decreased from R7.117billion 12months ago to R6.99billion currently. Inventories therefore showing an decrease of -1.78%. Inventories are therefore not a problem for WHL, perhaps management has been less optimistic about WHL's sales and ordered and kept less inventories, leading to the slight decline in their inventory levels.
3D donut | amCharts
From the pie charts it is clear that Woolworths Clothing and General Merchandise earns the strongest margins. It makes up under 21% of turnover but brings in around  34% of operating profit. Woolies foods the biggest contributor to turnover (making up more than a third (41%)) of turnover but only contributing 31% to operating profit. Clearly showing that margins are under pressure in the foods division. The two Australian operations David Jones and Country Road seems pretty stable in terms of contributions to both turnover and operating profits. The Aussie operations bringing in around .8% of all WHL's revenue (down from 42% in our last valuation of woolies). Their Aussie operations were tipped to make up more than half of their revenue and profits, but its a far cry from that currently.

A few financial ratios for WHL (calculated using our Financial Ratios Calculator):
  • Debt to Equity Ratio: 1.37  (more than 2 shows high levels of financial leverage). 
  • Current Ratio: 0.97 (A measure of liquidity. Less than one signals possible trouble in paying off current liabilities). 
  • Quick Ratio: 0.31 (Another liquidity measure. Shows how much in liquid assets is available to cover current liabilities or short term debt).  
  • Return on Assets (ROA):12.1%
  • Return on Equity (ROE): 28.6%
  • Net Profit Margin: 7.84%
  • Dividend Yield: 4.74%

Valuation: 
Based on WHL's current financial results we value them at between R96.50 and R96.77. We therefore feel that the sell off in WHL has been overdone and we expect WHL to offer long term shareholders buying at this price superior returns to the market if they willing to hold on and ride WHL back up. A valuation of R96.50 places WHL on a PE of 23. And yes current investors will say the PE is to expensive. At least some of that is offset by a strong dividend yield. And one has to remember WHL is an extremely strong brand and has a significant market presence in both the food and clothing space in SA. Others may not agree with our strong valuation price for WHL, but the dividend, their strong cash generation and solid balance sheet makes us overweight on WHL.

We use our Share Valuation Calculator as guide to valuing shares. We believe in value investing and our above mentioned share valuation is based on the underlying fundamentals and financial statements of the stock in question.

Additional Content:

Related Topics

  • Shoprite
  • Mr Price
  • Spar
  • Pick 'n Pay
  • ​Woolies Feb 2016


​Homepage

Economics Page
Stock in Focus Page


​About


Contact Us

Copyright © 2015
  • Home
  • Blog
    • Blog-5Jun2018
    • Blog-18May2018
    • Blog-16May2018
    • Blog-3May2018
    • Blog-2May2018
    • Blog-30Apr2018
    • Blog-26Apr2018
    • Blog-24Apr2018
    • Blog-18Apr2018
    • Blog-17Apr2018
    • Blog-16Apr2018
    • Blog-3Apr2018
    • Blog-22Mar2018
    • Blog-20Mar2018
    • Blog-19Mar2018
    • Blog-23Oct2017
    • Blog-20Oct2017
    • Blog-11Oct2017
    • Blog-10Oct2017
    • Blog-6Oct2017
    • Blog-3Oct2017
    • Blog-2Oct2017
  • Economics
    • Rand Dollar Exchange Rate
    • South Africa's GDP
    • South Africa's Unemployment
    • SA by numbers
    • Economic Progress Index
    • Taylors Rule
    • South Africa's Formal Business Sector
    • South-Africa's-Fiscal-Policy
    • SA EU Trade Data
    • Inflation Heat Map
    • Population Density Map
    • Labour Market Dynamics
    • Estimating the Size of the Informal Economy
    • SA Consumer Spending Patterns
    • South Africa's Monetary Fiscal Policy Mix
    • GDP Animations >
      • SouthAfrica
      • WesternCape
      • EasternCape
      • NorthernCape
      • FreeState
      • KwaZuluNatal
      • NorthWest
      • Gauteng
      • Mpumalanga
      • Limpopo
    • South Africa's Economic Structure
    • South Africa's Economic History
    • South Africa's Trade Data Page
    • South Africa's Food and Beverages Sector
    • Financial Well-being of South African Companies_2015
    • SA vs the World
    • Budget Day Page (24 Feb 2016)
  • Stock in Focus
    • JSE ALSI Chart
    • Sector Comparison Page
    • JSE-Calendar-Tracker-2019
    • Adcorp (ADR)
    • Amazon (AMZN)
    • Apple (AAPL)
    • Ascendis (ASC)
    • AVI (AVI)
    • Bidvest (BVT)
    • Blue Label Telecoms (BLU)
    • Bowler Metcalf (BCF)
    • Capitec (CPI)
    • City Lodge Hotel Group
    • Clicks Group (CLS)
    • Coronation (CML)
    • Curro Holdings (COH)
    • Discovery (DSY)
    • Distell (DST)
    • EOH (EOH)
    • Famous Brands (FBR)
    • Ferrari (RACE)
    • FirstRand Group (FSR)
    • Grindrod (GND)
    • GrowthPoint (GRT)
    • Holdsport (HSP)
    • Harley-Davidson (HOG)
    • Hyprop (HYP)
    • Hyprop (HYP)_1Jun2016
    • Investec Property Fund (IPF)
    • JSE (JSE)
    • Massmart (MSM)
    • MediClinic (MEI)
    • MTN (MTN)
    • MTN (MTN)_May2016
    • Mr Price Group (MRP)
    • Mr Price Group (MRP)_8APR2016
    • Nedbank (NED)
    • OneLogix (OLG)
    • Peregrine Holdings (PGR)
    • Pick 'n Pay Stores (PIK)
    • Pioneer Foods (PFG)
    • PSG Group (PSG)
    • Quantum Foods (QFH)
    • RCL Foods (RCL)
    • Remgro (REM)
    • Richemont (CFR)
    • RMB Holdings (RMH)
    • Rolfes (RLF)
    • Sanlam (SLM)
    • Sasol (SOL)
    • Sasol (SOL)_18sep2016
    • Santova (SNV)
    • Spar Group (SPP)
    • Shoprite Holdings (SHP)
    • Spur Corporation (SUR)_7Sep2017
    • Standard Bank (SBK)
    • Steinhoff International Holdings (SNH)
    • Stor-Age (SSS)
    • Super Group (SPG)
    • Taste Holdings (TAS)_30May2016
    • The Foshini Group (TFG)
    • Value Logistics (VLE)
    • Vodacom (VOD)
    • Wilson Bayly Holmes Ovcon (WBO)
    • Woolworths (WHL)
    • Woolworths (WHL)_24Aug2017
    • Zeder (ZED)
  • Online Calculators
    • Rand Petrol Price Estimator
    • Share Valuation
    • Financial Ratios Calculator
    • GDP Growth Estimator
    • Future Value of Investment Calculator
    • Loan repayment calculator
  • Contact
  • About
  • Search