|
|
Related Topics |
For the latest update on Pioneer Foods please click here
Background and overview of Pioneer Foods Group (PFG)
Pioneer Foods is the second largest listed Fast moving Consumer Goods (FMCG) company in South Africa, producing and distributing a range of branded food and beverage products. The Group operates mainly in South Africa, providing wholesale, retail and informal trade customers with products of a consistently high standard. Pioneer Foods exports to more than 60 countries across the globe. The growing international business represents 21% of operating profit. The Group operates a number of world-class production facilities producing a range of products that includes some of the most recognisable and best loved brand names in South Africa, including the following power brands: Weet-Bix, Liqui-Fruit, Ceres, Sasko, Safari, Spekko and White Star. For more information visit www.pioneerfoods.co.za
A couple of years ago Pioneer was the dog of the market after the competition commission of South Africa fined them for bread price fixing. Since then its been a slow long road to recovery for this company and it's shares. Below a technical analysis chart of PFG share price over the last 4 years.
A couple of years ago Pioneer was the dog of the market after the competition commission of South Africa fined them for bread price fixing. Since then its been a slow long road to recovery for this company and it's shares. Below a technical analysis chart of PFG share price over the last 4 years.
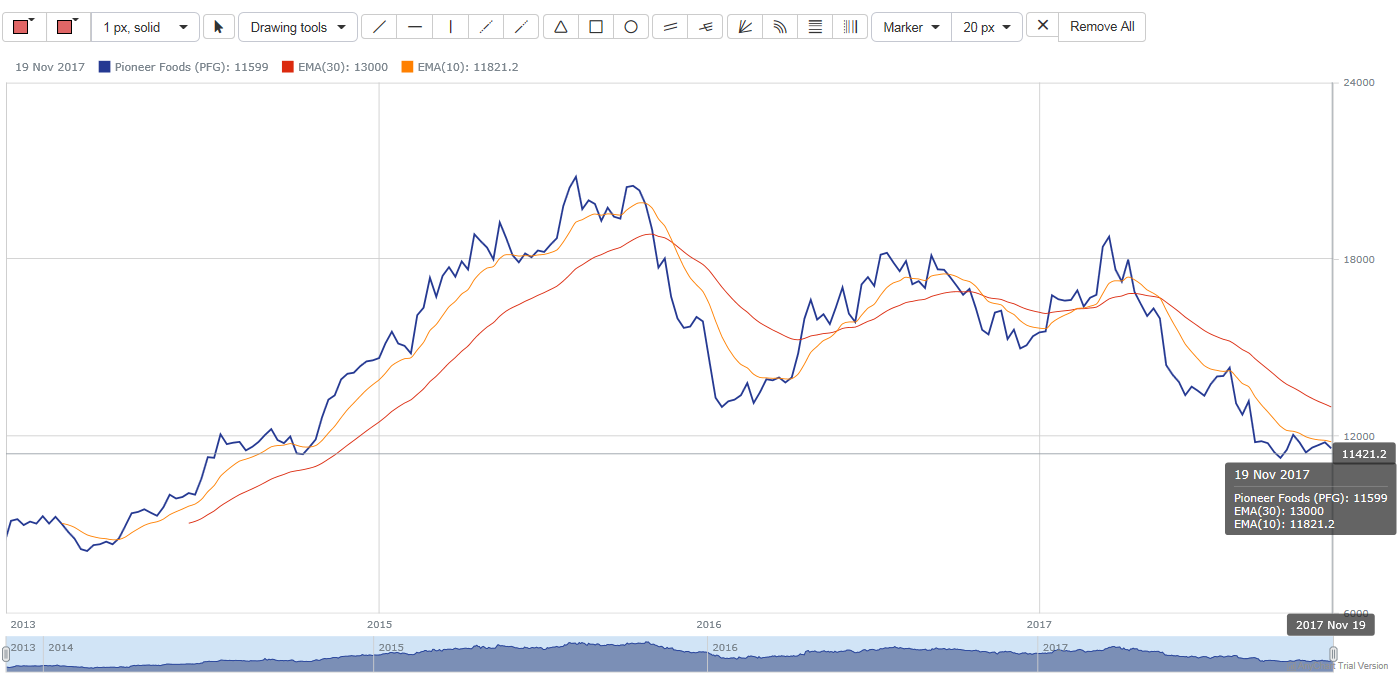
Pioneer Foods Share Price Graph
The PFG share price graphic shows the extended decline in PFG's share price from the highs reached in August 2015. Since then it has been pretty volatile but for the most part the trend has been downwards. This is confirmed by the EMA10 and EMA30 which are both trending downwards. Further negative pressure on the share price is confirmed by the fact that the EMA10 is well below the EMA30 showing significant short term downwards pressure on the PFG share price.
Scroll over or click on the funnel chart to get more details of PFGs latest financial results
Financial review:
Zeder (in which PSG group owns a major stake), owns a major stake in PFG. The benefit of this is the fact that PSG can via Zeder, influence what happens at PFG. PSG has track record of unlocking value for shareholders. So the hope is that they can do the same for PFG shareholders via their influence over ZED and ZED's influence over PFG. As can be seen from the funnel chart above PFG earned pretty strong net profit margins with it sitting at 8.2% in their previous set of financial results. It has however declined for the latest reporting period to a meager 3.8% .
PFG has worked on cutting operational costs over the last few years and it seems like this is bearing fruit. In their latest set of results PFG reported that costs of goods sold declined by 0.67% (or R97million) for year ended 2017 compared to 2016. Revenue declined by 5%, and adjusted headline earnings per share declined by a whopping 50%.
PFG has worked on cutting operational costs over the last few years and it seems like this is bearing fruit. In their latest set of results PFG reported that costs of goods sold declined by 0.67% (or R97million) for year ended 2017 compared to 2016. Revenue declined by 5%, and adjusted headline earnings per share declined by a whopping 50%.
The graphic below shows the contribution of some of PFG's operating divisions to their revenue and pre-tax profits
As can be seen from the pie charts above, PFG earns the majority of its revenues and profits from its essential foods division (which is SASKO, Speko and White Star brands), with it bringing in over 60% of revenue and around 55% in pre tax profits. Groceries division showed pretty similar contributions for both revenue and pre tax profits. The margins on their international operations (which includes international brands and joint ventures) are more profitable than their local operations. This is evident by the fact that their international division only makes up 13.8% of their revenue, but makes up almost 21.2% of their pre tax profits. Perhaps they should focus more on this division in order to boost margins for the group as a whole.
Adjusted headline earnings per share from continuing operations amounted to R4.42 a share (around half of what it was 12months prior). Putting PFG on a PE ratio of around 26. Which is exceptionally high, even for food producers. However margins will never be astronomically high. Current net profit margin is sitting at around 3.8%, but some of the margin declines being due to hedge losses of around R217mil. PFG's cash generated per share is far higher than that of earnings per share, coming in at around R12.85 a share, and cash of R430million on their balance sheet (or cash per share of R2.15 a share). Total dividend for the year amounted to a gross dividend of R3.65 a share, placing PFG on a dividend yield of 3.2%. While not earth shattering it does represent a dividend cover of 1.1
A few financial ratios to mull over for PFG
- Net Profit Margin: 3.85%
- Dividend Yield: 3.2%
- Cash as % of total assets: 2.3%
Valuation
Based on PFGs financial results, the markets they operate in and the economic environment they find themselves in, we value PFG at between R137.28 and R140 a share. We therefore feel that PFG is currently a little undervalued. Investors should look to buy or top up on their holdings at prices close to or below R115 a share mark. If their earnings recover to levels of the prior 12months (after hedging losses etc.) the share could easily go back up to our previous year's valuation levels of over R160 a share. Our valuation is based on the fact that we expect earnings to recover to last years levels over the next reporting period and additional write offs and losses to be limited. And if their earnings recover to levels of last year, PFG is currently trading at a forward PE of around 14, which is well below the market average and extremely reasonable for a food producer.
We use our Share Valuation Calculator as guide to valuing shares. We believe in value investing and our above mentioned share valuation is based on the underlying fundamentals and financial statements of the stock in question.
We use our Share Valuation Calculator as guide to valuing shares. We believe in value investing and our above mentioned share valuation is based on the underlying fundamentals and financial statements of the stock in question.