|
American States Water Company (NYSE:AWR) quarterly results for period ending September 2018
Date: 12 November 2018 Category: Stock Market Share price at time of writing: $64.43 |
Related Topics |
|
We take a look at Californian based, American States Water Company's quarterly earnings report for the period ending September 2018.
|

|
About American States Water Company (AWR)
American States Water Company is the parent of Golden State Water Company and American States Utility Services, Inc. Through its utility subsidiary, Golden State Water Company, AWR provides water service to approximately 259,000 customers throughout 10 counties in Northern, Coastal and Southern California. The Company also distributes electricity to approximately 24,000 customers in the Big Bear recreational area of California. Through its contracted services subsidiary, American States Utility Services, Inc., the Company provides operations, maintenance and construction management services for water and wastewater systems located on military bases throughout the country under 50-year privatization contracts with the U.S. Government.
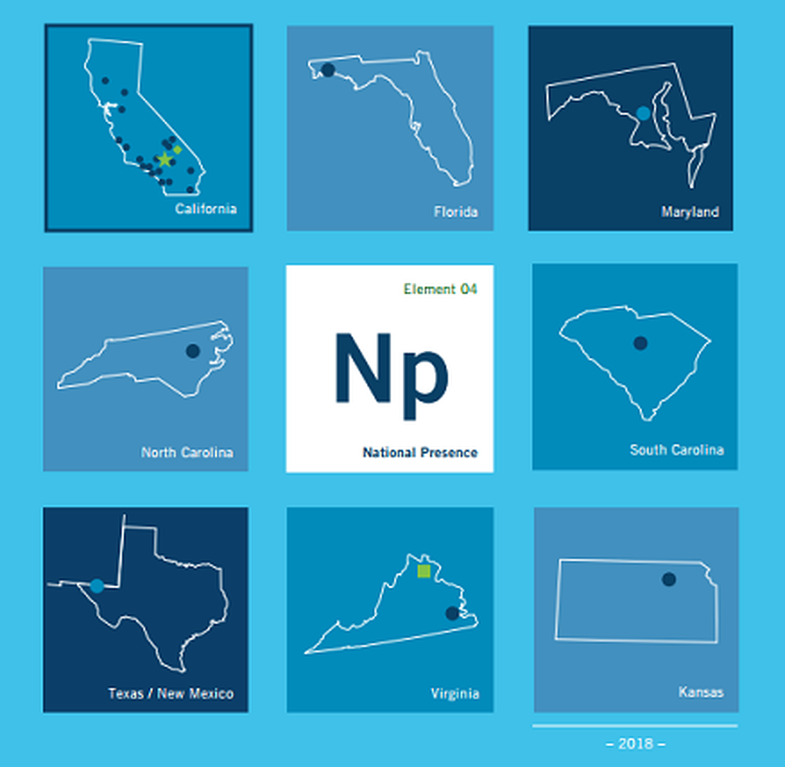
In 2017, American States Utility Services, our contracted services subsidiary, was awarded a 50-year contract to operate and maintain the water, wastewater and related treatment facilities at Fort Riley, Kansas. The value of the contract: approximately $601 million. This milestone enables us to bring outstanding service to more people, as we increase value for shareholders, and further positions us for future growth. We are proud to serve several of the U.S. military’s largest installations, and 11 bases in total.
As a solid component of any investment strategy, we are proud to deliver measured, reasonable returns to our shareholders—including paying dividends to shareholders every year since 1931, and increasing the dividends received by shareholders each calendar year for 63 consecutive years. In 2017, our dividend increased by 5.4 percent over the year prior.
The image below shows AWR's presence within the United States
So to the numbers we go
- Total operating revenue: $124.2 million (down 0.2% from $124.4 million the prior year)
- Operating expenses: $90.2 million (up 5% from $85.9 million the prior year)
- Net income: $22.9 million (up 9% from $21 million). Even though revenues were lower and operating expenses higher they reported higher net income largely due to income tax expense being almost $6 million lower.
- Earnings per share: $0.64 (up 12.2% from $0.57 the prior year). They are currently trading on a forward PE ratio in the high 20's of around 25.8
- Dividend per common share: $0.275 (up 7.8% from $0.255 the prior year). Which places them on a very low dividend yield of roughly 1.7%
So any comments or guidance from management on the results?
The group released the following comments with their 3rd quarter earnings report.
Water Segment:
For the three months ended September 30, 2018, fully diluted earnings per share from the water segment of Golden State Water Company ("GSWC"), a subsidiary of American States Water Company, increased by $0.03 per share as compared to the same period in 2017. Excluding the effects of the Tax Cuts and Jobs Act (“Tax Act”) enacted in December 2017 and billed surcharges, both of which have no material impact to earnings, the following items affected the comparability between the two periods:
- An overall increase in the water gross margin, which increased net earnings by approximately $0.02 per share, was due primarily to third-year rate increases approved by the California Public Utilities Commission (“CPUC”) effective January 1, 2018. This increase was partially offset by the revenue impact from a lower authorized return on rate base approved in the cost of capital decision issued by the CPUC in March 2018, which was effective in 2018. The lower authorized return decreased the water gross margin during the three months endedSeptember 30, 2018 by approximately $0.02 per share.
- An overall increase in operating expenses (other than supply costs), which decreased earnings by approximately $0.02 per share, was due primarily to higher employee-related benefits, depreciation expense and property taxes.
- A lower effective income tax rate (excluding the effects of the Tax Act), which increased earnings by approximately $0.03 per share, was due primarily to differences between book and taxable income that are treated as flow-through adjustments in accordance with regulatory requirements (primarily related to plant, rate case and compensation-related items). Flow-through adjustments increase or decrease tax expense in one period, with an offsetting decrease or increase in another period.
Electric Segment:
For the three months ended September 30, 2018, diluted earnings from the electric segment were $0.02 per share as compared to $0.03 per share for the same period in 2017. The decrease in earnings was largely due to an increase in operating expenses without an increase in customer rates due to delays in finalizing the pending electric general rate case. GSWC filed its electric general rate case in May 2017 for new rates in the years 2018-2021. Because of the delay, year-to-date 2018 billed revenues have been based on 2017 adopted rates, pending a final CPUC decision on the electric general rate case. When approved, the new rates will be retroactive to January 1, 2018.
Contracted Services Segment:
For the three months ended September 30, 2018, diluted earnings per share from the contracted services segment increased by $0.03 per share as compared to the same period in 2017 due, in large part, to the commencement of operations at Eglin Air Force Base (“Eglin AFB”) in June 2017 and at Fort Riley in July 2018, which resulted in an overall increase in contracted services revenue. This increase was partially offset by increases in operating expenses, largely related to the commencement of operations at Fort Riley in July 2018.
So should you buy their shares?
Well a big plus for the group is the fact that they secured a contract with the US government, worth around $600 million to operate, maintain and provide construction management services for the water distribution and waste water collection, and treatment facilities at Fort Riley, a United States Army installation in Kansas. And management of the system began in 2018. According to the group "This is the second year in a row that ASUS received the largest military privatization contract awarded by the U.S. government for water and wastewater systems. The award of the Fort Riley contract brings the total number of bases that we serve to 11." The fact that they are getting more and more business from the state is possibly the reason and justification for the high Price to earnings ratio (PE) of the group.
American States Water Company valuation
While revenues for the 3rd quarter declined compared to 2017, the dividend was increased and the earnings per share was higher (largely due to lower tax bill). But the lower tax bill flatters the numbers, and made more cash available to up the dividend. They trade on a high PE ratio and a low dividend yield. While we agree state contracts is good for the group, the latest one that was awarded to them will at best boost earnings by say 10% a year from its current level. This will still imply a PE ratio of over 20. We do not think the group's market they operate in and other variables such as their low dividend yield justifies the higher price. Based on our estimates and valuation models we value them at most at $56 a share. We therefore feel they are over priced and would not recommend investors buy the shares at the current price.