|
Related Topics |
|
A topic often discussed when economic growth is brought up is a country's monetary and fiscal policy mix. Monetary policy refers to the control of a countries money supply. This policy is set by the South African Reserve Bank (SARB). Fiscal policy refers to spending by the state/government. This is set by National Treasury.
The first few questions that need answering is what exactly is monetary policy and what is fiscal policy? Monetary policy refers to the policies set my those in charge of the monetary system of a country. This is usually the central banks of countries. The central bank and the policies it implements (such as interest rates, reserve requirements for banks etc) is known as monetary policy. Fiscal policy refers to the spending policies of the various governments. This includes government spending and taxes. Essentially fiscal policy has to do with the budget of a country and how its financed . In this analysis we determine whether monetary and fiscal policy is expansionary or contractionary as follows: Expansionary monetary policy is seen as when interest rates have decreased during a year, contractionary monetary policy is seen as when interest rates increased during a year. Expansionary fiscal policy is seen as when government spending increased by a bigger percentage during a specific year than the year before it. I.e when there is an acceleration in spending growth. Contractionary fiscal policy is seen as when government spending grows at a slower rate than the previous year/or has decreased. The graphic below shows South Africa's Monetary Fiscal Policy Mix (and the associated GDP) for the last 22 years (from 1994 to 2015). Scroll over a bubble to see the GDP growth rate and the year in question. |
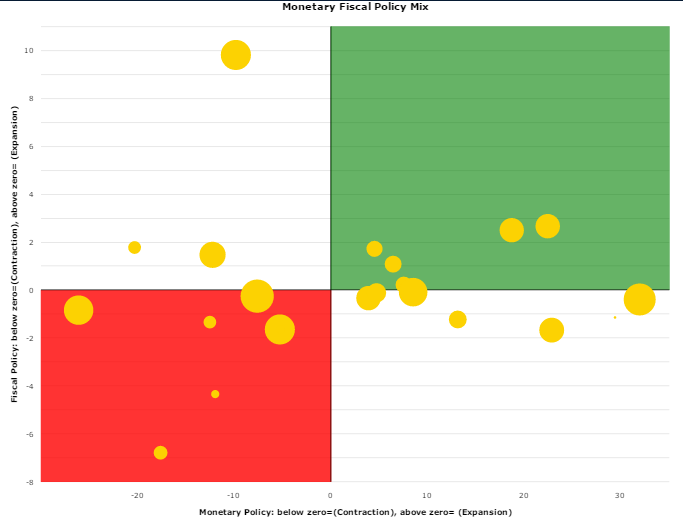
South Africa's monetary fiscal policy mix
|
There are four main blocks in the graphic. They can be interpreted as follows:
Often economic growth (GDP) is impeded when there is conflicting policies at play. For example if a government want to stimulate economic growth of a country, they can increase their spending to boost aggregate demand. But what happens if the central bank or entity responsible for interest rate setting in that country increases interest rates (which leads to curbing consumer spending). Thus you will have increased government spending but lower consumer spending. Both of which is crucial to economic growth.
- Top Left: Expansionary Fiscal Policy, Contractionary Monetary Policy
- Top Right: Expansionary Fiscal Policy, Expansionary Monetary Policy (Green Block)
- Bottom Left: Contractionary Fiscal Policy, Contractionary Monetary Policy (Red Block)
- Bottom Right: Contractionary Fiscal Policy, Expansionary Monetary Policy
Often economic growth (GDP) is impeded when there is conflicting policies at play. For example if a government want to stimulate economic growth of a country, they can increase their spending to boost aggregate demand. But what happens if the central bank or entity responsible for interest rate setting in that country increases interest rates (which leads to curbing consumer spending). Thus you will have increased government spending but lower consumer spending. Both of which is crucial to economic growth.
From the graphic its clear that there has been a lot of expansionary monetary policy (bubbles to the right of the vertical line going through zero. Fiscal policy has been a lot less expansionary (as government tries to curb its spending). The rules applied to decide whether policy is expansionary might be a little strict contributing to this interpretation (since we classifying expansionary fiscal policy as growth being faster than the previous year and not just looking at positive growth. I.e. accelerating growth was seen as expansion, slowing growth and decreases in government spending was seen as contractionary fiscal policy).
Of the 22 years in question, there were 7 years in which both monetary and fiscal policy was seen as contractionary, and 5 years in which both monetary and fiscal policy was seen as expansionary.
Average GDP growth rates:
Coordinated contractionary policy (Red block): 2.86%
Coordinated expansionary policy (Green block): 2.91%
Uncoordinated policy: 3.42%
Just looking at monetary and fiscal policy in isolation the following GDP growth rates are achieved:
Fiscal Policy:
Contractionary: 3%
Expansionary: 3.2%
Monetary Policy:
Contractionary: 3.2%
Expansionary: 3.1%
But the timing of expansionary fiscal and monetary policy has to be taken into account, as it usually takes a while for policies to feed through into the economy (especially monetary policy). This feed through into the economy is known as the transmission mechanism. For this reason we calculate these rates again below, by lagging GDP growth rates by a year.
Lagged GDP data:
The graphic below shows if a one year lag is added to GDP. Essentially saying it took a year for the fiscal and monetary policy to feed through to the economy. (Thus expansionary monetary and fiscal policy set in 2002 leads to 2002's economic growth rate).
Of the 21 years in question (2015 monetary and fiscal policy mix falls away as we assigning 2015 GDP growth to 2014 monetary and fiscal policy mix), there were 6 years in which both monetary and fiscal policy was seen as contractionary, and 5 years in which both monetary and fiscal policy was seen as expansionary.
Average GDP growth rates:
Coordinated contractionary policy (Red block): 2.74%
Coordinated expansionary policy (Green block): 3.83%
Uncoordinated policy: 2.92%
This clearly shows that if there is coordinated policy to either expand the economy or to cool it down, the impact is far greater when policy is coordinated. Just looking at monetary and fiscal policy in isolation the following GDP growth rates are achieved:
Fiscal Policy:
Contractionary: 3%
Expansionary: 3.2%
Monetary Policy:
Contractionary: 2.6%
Expansionary: 3.5%
South Africa's monetary and fiscal policy does seem a little disjointed and there is no clear evidence that our monetary and fiscal policy is coordinated. In the two graphics only about 54% of the time policy was seen to be coordinated. A coordinated monetary and fiscal policy would see the bubbles clustered together a lot more. Instead of spread out as is the case.
A more coordinated monetary and fiscal policy would have the effect of growing the economy more effectively when the aim is to grow it (monetary and fiscal policy are expansionary. I.e bubbles in the green block) and to slow it down when there are fears of the economy overheating (contractionary monetary and fiscal policy. I.e bubbles in the red block), as shown by the results of the graphic in which GDP was lagged to give policy time to filter through to the economy.
The sole mandate of the South African Reserve Bank (SARB) is to target inflation (keeping it between 3% and 6%). The problem with SARB's fixation with inflation targeting is the fact that if inflation starts increasing (due to external factors such as rising oil prices or droughts and not consumer demand), and government is looking to boost economic growth by increasing overall demand in the economy, SARB will start raising interest rates to control inflation (even when inflation might be caused by factors outside consumers control), and this will lower consumer demand, weakening efforts from government to boost economic growth. It is therefore import for coordinate policies to exist, especially if government wants to achieve its economic growth targets that they have been talking about over the last couple of years.
From the growth rates it is clear the strongest growth is achieved when both monetary and fiscal policy are expansionary, and lowest growth is achieved when monetary and fiscal policy are contractionary. This clearly shows that coordinated policies are more effective in achieving what needs to be achieved. Perhaps its time National Treasury and South African Reserve Bank sit down together to discuss exactly what the overall aim and targets are for South Africa over the next couple of years. As our uncoordinated policies are doing us no economic favours.
Data disclaimer:
Average annual GDP growth rates calculated shows average annualised GDP, 2010 constant prices, seasonally adjusted data for each year: Source Stats SA.
Government Spending. Government Final Consumption Expenditure per year. Source: South African Reserve Bank (SARB)
Interest Rates: Lowest Bank Rate as per South African Reserve Bank (SARB)