|
Related Topics |
Background and overview of PSG Group (PSG)
PSG Group is an investment holding company that holds significant stakes in various listed and unlisted companies. Some of PSG's biggest investments include:
30.7% stake in Capitec Bank (CPI).
58.3% stake in Curro Holdings (COH)
34.6% stake in Zeder (ZED).
61.9% stake in PSG Konsult
According to PSG their investment strategy and philosophy can be defined as:
More information on PSG Group can be found at www.psggroup.co.za
Below our interactive share price chart for PSG Group over the last 4 years. Note the chart is interactive and has various technical analysis functions
30.7% stake in Capitec Bank (CPI).
58.3% stake in Curro Holdings (COH)
34.6% stake in Zeder (ZED).
61.9% stake in PSG Konsult
According to PSG their investment strategy and philosophy can be defined as:
- We invest in companies with uncomplicated business models operating in industries with attractive growth prospects and led by talented, hard-working and passionate people.
- We believe in co-investing with management – management as owners are generally focused and dedicated to continuously grow their businesses.
- A culture of good corporate governance is instilled at board level and is applicable to the entire organisation. It remains a cornerstone of the way we do business. In our opinion, however, good corporate governance is not necessarily represented by set rules, policies or codes, committees or meetings. It is rather relevant, transparent, timely, accurate and succinct information provided to those charged with oversight who, by their nature, are trustworthy and ambitious to act in the best interests of the company.
- We are long-term strategic investors with no predefined exit strategy.
- We add value by challenging management to innovate and grow their businesses, both organically and by means of acquisitions. We provide funding when needed.
- A company can only grow when its customer base increases. A focus on client satisfaction thus remains vitally important for our continued success.
- Funding remains critically important and integral to what we do
More information on PSG Group can be found at www.psggroup.co.za
Below our interactive share price chart for PSG Group over the last 4 years. Note the chart is interactive and has various technical analysis functions
Fibonacci Fan |
Andrew's Pitchfork |
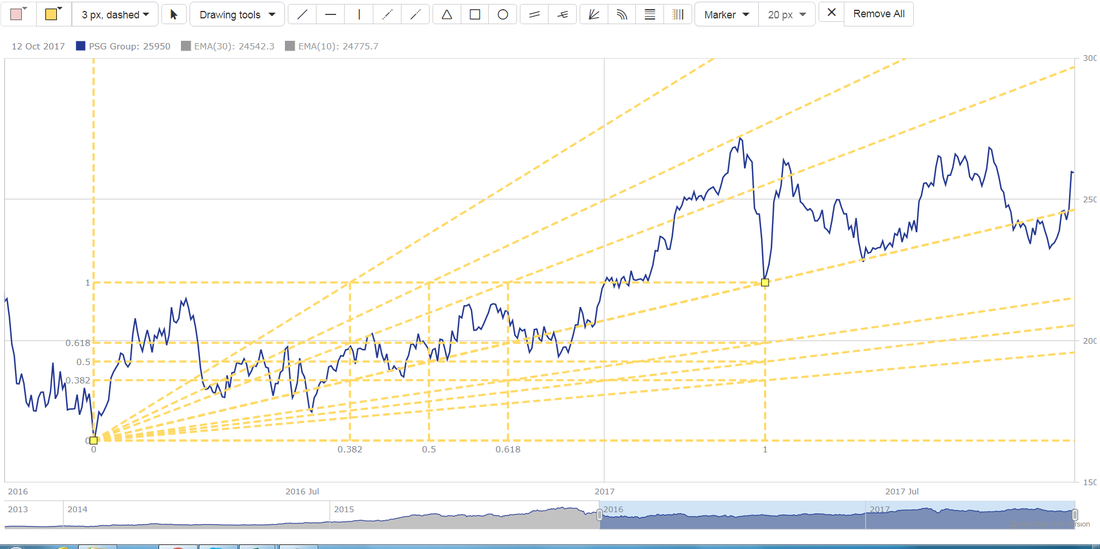
Fibonacci Fan on PSG share price
|
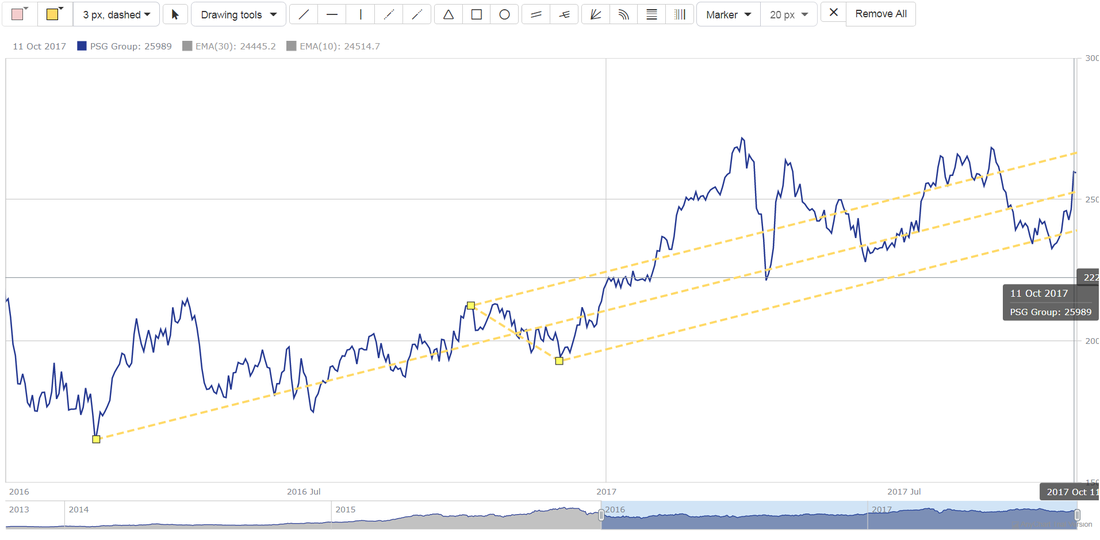
Andrew's Pitchfork on PSG share price
|
Both these images above shows possible support or resistance levels for PSG's share price. Using two different technical analysis methods available on our chart.
Financial review:
PSG is a holding company and not really an operating entity. This does make valuing the stock a little harder than operating entities, as cash flows, earnings and expenses cannot be used in the same was as operating entities to value a share. For holding companies one would look at the value of net assets (and net asset value per share) in order to get an indication of the worth of the companies assets per share.
The graphic below shows the contribution of PSG's holdings to their total Net Asset Value (NAV). As can be seen from the pie chart by far the biggest contributor to PSG's NAV is their holding in Capitec. The growth in Capitec has been largely responsible for the incredible growth in PSG's share price over the last 10 years. PSG's NAV (or as they report it sum of the parts (SOTP) at the publication of their last financial results (for year ending 29 February 2016)) was R186.67 a share.
If Capitec can keep up the momentum that they have been gathering over the last couple of years, and not fall into the trap of just pushing for as many clients as possible, but actually keep providing a quality service to their new and existing clients, they have a very bright future ahead., and by virtue of that PSG will have a bright future thanks to their large holding in Capitec. But as we wrote in our write up for Capitec, they are currently a little overvalued. Over the last six months (from half year results to year end results,
PSG has increased their stake in Zeder slightly (even with this increased holding ZED's contribution to PSG's overall SOTP dropped from 8% to 7% in the 2nd six months of PSG's financial year). As our previous review shows, 6months ago, Capitec contributed 43% to the total SOTP of PSG. This has increased by 3% of the last 6months, while ZED and PSG Konsults contributions to the total SOTP of PSG has drooped.
PSG has a excellent track record of unlocking value for shareholders over the long run. PSG should focus on unlocking value of slow mover Zeder. Zeder has quality assets but is trading at a large discount to its total assets. In addition to this PSG should look to invest in fast growing undervalued assets with the massive amounts of cash/capital they have access to. PSG is sitting on R1billion in cash, and we are sure the market is waiting with bated breath to see what they do with that warchest.
Valuation
Based PSG's current financial results and their SOTP as reported on their website at end 18 April 2016 PSG is valued at R206.58 a share. We feel PSG deserves to trade at a small premium to the SOTP as reported in their last financial results (RR186) due to their history of unlocking great value for shareholders over time. We therefore value them at R216.90 (5% premium to the SOTP as quoted in their last set of financial results). They are therefore close to fully priced based on their current share price.