|
Related Topics |
|
In today's blog we take a look at the performance of Famous Brands vs Taste vs Spur. The main fast food and sit down chains listed on the JSE. And after Famous Brands (FBR) latest trading statement things are not looking good for them. The graphic compares the share prices of the 3 companies for the last 4 years (and includes the share prices of the stocks as at 10am on 10th October 2017. And as one can see Famous Brands share price has fallen off a cliff.
Note data obtained from PSGOnline which is part of the PSG group. www.psg.co.za |
Slowly but steady. Spur winning this race
The comparison graphic below shows the performance of Spur vs Famous Brands vs Taste. Users can change the dates, select 1 year, year to date (YTD), 1 months etc and it recalculates the share price performance of the various shares over time period selected. Please enjoy and play around with the graphic
The picture below shows the 1 year returns of Taste, Famous Brands and Spur. And its clear that while all 3 companies share prices have fallen over the last year, Spur's decline is a lot less pronounced than that of the other two companies.
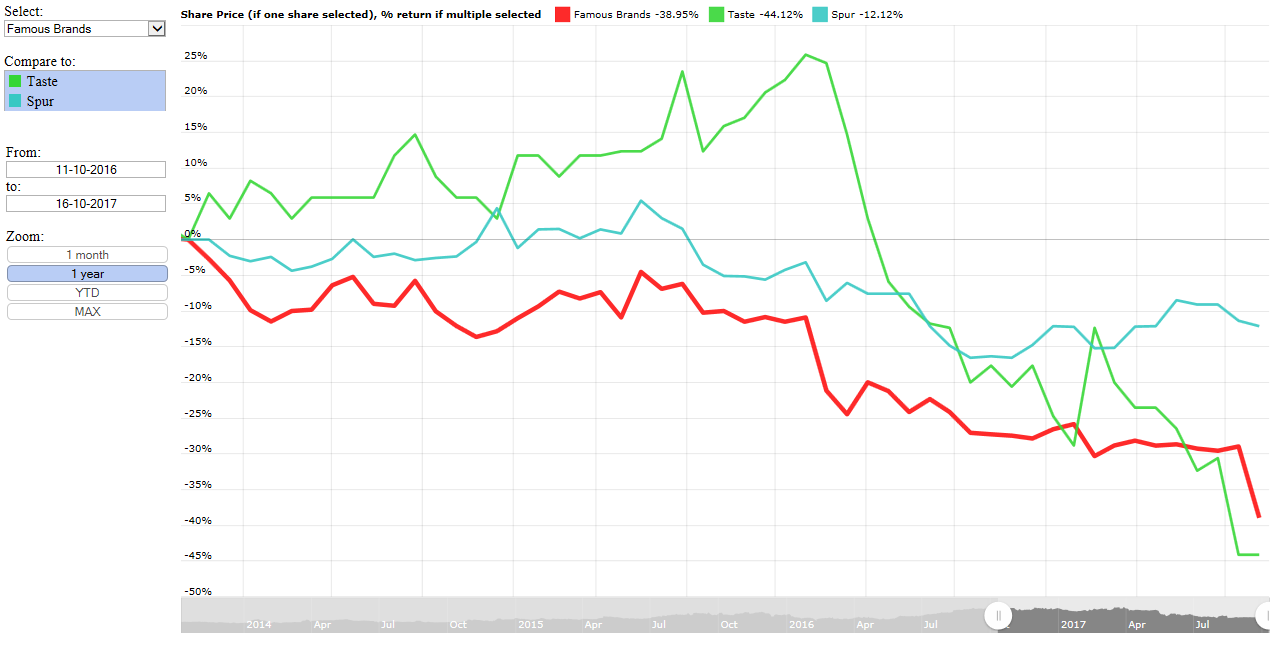
While Spur, Taste and Famous Brands have all declined over the last 12months, Famous Brands down almost as much as Taste after their latest trading statement
So what has caused the sell off in Famous Brands? Well their operations in the UK that they are funding with massive amounts of debt has lost money in the last 6months and this has materially affected FBR's profit forecasts. Below the SENS announcement that has lead to FBR being smacked.
TRADING STATEMENT FOR THE SIX MONTHS ENDED 31 AUGUST 2017
Famous Brands is satisfied that a reasonable degree of certainty exists with regard to the financial results of the Group for the six months ended 31 August 2017 (“the review period”) and thus is in a position to issue this trading statement in terms of Section 3.4(b)(i) of the Listings Requirements of the JSE Limited. BUSINESS PERFORMANCE On 16 August 2017, the Group published a voluntary performance update (“the update”) for its South African (SA) and Rest of Africa and Middle East (AME) regions for the 20-week period ended 31 July 2017, as well as for the recently acquired UK business, Gourmet Burger Kitchen (GBK), for the 22-week period ended 31 July 2017. The update noted that trading conditions in these markets had deteriorated over the specified period as a result of weak consumer confidence levels, macro-economic pressure on disposable income, socio-political uncertainty and an intensification of competition. Unfortunately, these conditions persisted over the balance of the review period between 31 July and 31 August 2017.
In this context, the Group’s SA business (comprising its Franchise and Development, Logistics and Manufacturing divisions) will report a satisfactory improvement in Profit Before Interest and Tax (“PBIT”) compared to the prior period. Disappointingly, GBK recorded a PBIT loss of GBP872 000 for the period. This loss is primarily attributable to the prevailing adverse trading environment in the UK, however, as noted in the update, the Board of Directors (“the Board”) is confident that innovative interventions currently being implemented in the business by management will have a positive impact on future performance. These measures include intensified focus on the management of new restaurants opened, improving operational efficiencies, and enhancing cost controls - including curtailing the opening of further restaurants in the short term given the high pre-opening capital costs, averaging GBP1 million per store. In the current macro-economic environment, the Board is of the opinion that GBK’s return to profitability will only be achieved in the next financial year, however it remains optimistic that the operation will add value to the Group in time. RESULTS As cautioned in the update, the Group’s consolidated results for the six months under review are weaker than those reported in the prior comparable period, negatively affected by: - the increase in net finance costs from R8 million in the prior comparable period to R138 million in the current period; and - the operating loss incurred by the GBK business. The following non-operational exceptional items were included in the results for the six months ended 31 August 2016, but had no bearing on the current results under review, namely: - a derivative gain of R141 million on the call option utilised to hedge the purchase price of the acquisition of GBK; and - a R20 million impairment of the investment made in 2013 in UAC Restaurants Limited in Nigeria.
For the six months ended 31 August 2017, headline earnings per share (“HEPS”) compared to the prior comparable period are expected to decrease to within the range of 153 cents per share to 187 cents per share (2016: 411 cents per share), being an approximate 54% to 63% decrease when compared to the prior comparable HEPS. Basic earnings per share (“EPS”) compared to the prior comparable period are expected to decrease to within the range of 154 cents per share to 188 cents per share (2016: 391 cents per share), being an approximate 52% to 61% decrease when compared to the prior comparable EPS. The financial information on which this trading statement is based has not been reviewed or reported on by the Company’s external auditors. The results for the review period will be released on SENS on or about Monday, 30 October 2017.