|
Related Topics |
|
In today's blog we take a look at South African consumer spending patterns and changes over the last 6 years, based on the latest data published by Statistics South Africa's GDP by expenditure method data.
The data provides valuable insights into what exactly South African consumers spend their hard earned money on. |
|
Its all about Food, Transport and Housing
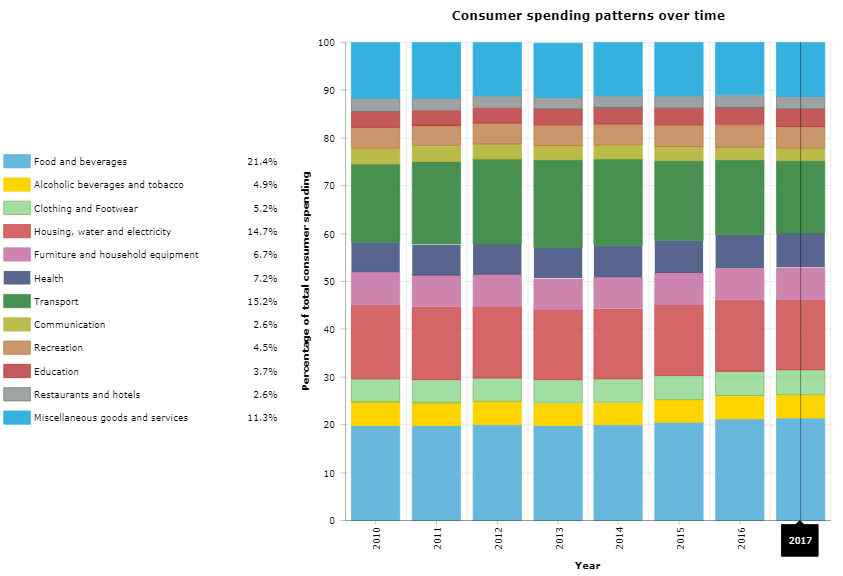
The stacked bar chart below shows the 12 main expenditure groups consumer expenditure is grouped into per year for the last 7 years. The summary belows shows the percentage of total consumers spending in South Africa in 2010 on the 12 main expenditure groups:
- Food and non-alcohol beverages: 19.8%
- Alcohol beverages, tobacco and narcotics: 5.0%
- Clothing and footwear: 4.9%
- Housing, water, electricity, gas and other fuels: 15.4%
- Furnishings, household equipment, maintenance: 6.8%
- Health: 6.3%
- Transport: 16.4%
- Communication: 3.3%
- Recreation and culture: 4.3%
- Education: 3.3%
- Restaurants and hotels: 2.8%
- Miscellaneous goods and services: 11.7%
So based on the summary and graphic above around R19.20 out of every R100 spent by South African consumers in 2010 were spent on Food and non alcoholic beverages. making it the single biggest expenditure group, by 2017 this has risen to R21.40 out of every R100 spent by South African consumers were spent on Food and non-alcoholic beverages. The second biggest expenditure group was Transport (which includes All Car repayments, insurance and maintenance of vehicles as well as fuel). This groups also contains all expenditure on bus, train and taxi fares). Worrying for South Africans is the fact that such a large portion of total expenditure goes towards transport. Part of the problem is due to the fact that a large number of South Africans stay far away from their place of their employment.
Its commonly referred to as 40/40. Consumers stay 40kms away from where they work and take on average 40minutes to get to work, This is largely as a result of poor town planning and poor CBD development, in particular housing during the apartheid years. And this urban sprawl cause by people not wanting or being able to stay close to their place of employment has lead to massive traffic on roads, long routes to get to work etc, and this is partly why Transport makes up such a big part of South African consumers total spending. However by 2017, South African consumers spent R15.20 out of every R100 on Transport, showing a steady decline in transport spending costs. Lower fuel prices in recent years having contributed to this.
The 3rd biggest expenditure group is Housing, water and electricity with about R15.40 out of every R100 spent by South African consumers in 2010 being spent on this group. Soe might be surprised at the level of housing as one would expect this makes up a far larger part of poor people's expenditure. While this is the case, total expenditure in South Africa is dominated by a small number of people, According to the Consumer Price Index data the richest 10% of households spends 48% of all money in South Africa.
While consumer spending patterns over time is slow to change (as the stacked bar chart above shows) there has been slight changes that has taken place in South African consumers spending patterns over the last 7 years. The summary below shows the changes in each of the 12 main expenditure groups from 2010 to 2017. So which groups relative importance has increased or decreased over the last 7 years.
The big changes in what consumers are spending their money on over time took place in Food and alcoholic beverages. and in Health, while there has been a substantial decline in relative importance of Communication, with its importance dropping by over 20%. This can largely be attributed to the declines in cost of making calls, and the large drop in the price of data for smart phones and home internet.
Interestingly the relative importance of alcoholic beverages and tobacco has declined, this is not due to less alcohol being consumed but in fact due to less cigarettes being sold as the impact on people's health from smoking has had a detrimental effect on cigarette sales. But one wonders if the Statistics agency properly accounts for e-cigarettes and the likes?
- Food and non-alcohol beverages: 8.0%
- Alcohol beverages, tobacco and narcotics: -1.7%
- Clothing and footwear: 5.7%
- Housing, water, electricity, gas and other fuels: -4.2%
- Furnishings, household equipment, maintenance: -1.7%
- Health: 14.3%
- Transport: -7.5%
- Communication: -21.7%
- Recreation and culture: 4.9%
- Education: 12.0%
- Restaurants and hotels: -4.5%
- Miscellaneous goods and services: -3.8%
The big changes in what consumers are spending their money on over time took place in Food and alcoholic beverages. and in Health, while there has been a substantial decline in relative importance of Communication, with its importance dropping by over 20%. This can largely be attributed to the declines in cost of making calls, and the large drop in the price of data for smart phones and home internet.
Interestingly the relative importance of alcoholic beverages and tobacco has declined, this is not due to less alcohol being consumed but in fact due to less cigarettes being sold as the impact on people's health from smoking has had a detrimental effect on cigarette sales. But one wonders if the Statistics agency properly accounts for e-cigarettes and the likes?
Let us know what you thought of this article: |