|
Related Topics
|
27 July 2020: Mid year population estimates for South Africa (2020)
According to the latest mid year population estimates there are 59.62 million people living in South Africa. Below a breakdown per province:
Gauteng is by far the most populous province in South Africa with more than 25% of the country's population living in its smallest province. A distant second place goes to KwaZulu-Natal and the third most populous province in South Africa is the Western Cape closely followed by the Eastern Cape
- Western Cape: 7 005 741
- Eastern Cape: 6 734 001
- Northern Cape: 1 292 786
- Free State: 2 928 903
- KwaZulu-Natal: 11 531 628
- North West: 4 108 816
- Gauteng: 15 488 137
- Mpumalanga: 4 679 786
- Limpopo: 5 852 553
- Total: 59 622 350
Gauteng is by far the most populous province in South Africa with more than 25% of the country's population living in its smallest province. A distant second place goes to KwaZulu-Natal and the third most populous province in South Africa is the Western Cape closely followed by the Eastern Cape
5 May 2020: Dwelling types in South Africa
While we all had to suffer through the 5 weeks of lockdown and to a lesser extent through the lockdown level 4, lets take a look at the various dwelling/housing types in South Africa, as at 2018 according to Statistics South Africa's General Household Survey
Property Description Total
So remember while you might be sitting in your comfortable home during the lockdown there are literally millions of informal dwellings people live in and imagine how hard that must be spending all your time in informal dwellings. So while you complain about others potentially not sticking to the lockdown rules, remember that there might be a reason why people are breaking them, even if it is to get out of a shack or informal dwelling for a while.
Property Description Total
- Dwelling/house or brick/concrete block structure on a separate stand or yard or on farm: 10 499 150
- Traditional dwelling/hut/structure made of traditional materials: 830 855
- Flat or apartment in a block of flats: 785 593
- Cluster house in complex: 143 196
- Town house (semi-detached house in complex): 286 198
- Semi-detached house: 261 785
- Dwelling/house/flat/room in backyard: 671 177
- Informal dwelling/shack in backyard: 922 730
- Informal dwelling/shack not in backyard, e.g. in an informal/squatter settlement or on farm: 1 260 890
- Room/flatlet on a property or a larger dwelling servants' quarters/granny flat: 874 639
- Caravan/tent: 9 854
- Other: 124 786
So remember while you might be sitting in your comfortable home during the lockdown there are literally millions of informal dwellings people live in and imagine how hard that must be spending all your time in informal dwellings. So while you complain about others potentially not sticking to the lockdown rules, remember that there might be a reason why people are breaking them, even if it is to get out of a shack or informal dwelling for a while.
23 March 2020: Coronavirus most prevalent in most densly populated province in South Africa
The heat map below shows the number of confirmed Coronavirus cases per province in South Africa for the 22 March 2020 and 23 March 2020. And more than 50% of the confirmed Coronavirus cases are in Gauteng.
30 July 2019: South Africa's latest mid year population estimates
So how many people are currently living in South Africa? Or ever wondered how many people live in each province of South Africa? Well Statistics South Africa (Stats SA) released the latest mid year population estimates for South Africa so the numbers below shows the latest population estimates per province of South Africa.
So as at June 2019 there were an estimated 58.78 million people living in South Africa. An increase of over 1 million people over the last 12 months. That is an increase of 1.78%. This while the economy is growing at far less than 1% a year. So essentially we as South Africans are getting poorer by the person
- Gauteng: 15 176 116 (25.8%)
- KwaZulu-Natal: 11 289 086 (19.2%)
- Western Cape: 6 844 272 (11.6%)
- Eastern Cape: 6 712 276 (11.4%)
- Limpopo: 5 982 584 (10.2%)
- Mpumalanga: 4 592 187 (7.8%)
- North West: 4 027 160 (6.9%)
- Free State: 2 887 465 (4.9%)
- Northern Cape: 1 263 875 (2.2%)
- South Africa: 58 775 022
So as at June 2019 there were an estimated 58.78 million people living in South Africa. An increase of over 1 million people over the last 12 months. That is an increase of 1.78%. This while the economy is growing at far less than 1% a year. So essentially we as South Africans are getting poorer by the person
Advertisement (and yes South Africans can buy from Amazon as they deliver to SA)
29 May 2019: General Household Survey results and what is says about SA's population
We take a look at the latest numbers from the General Household Survey (GHS) and what is says about South Africa's population per province or more importantly in this update we will focus on the number of households per province over time. The table below shows the estimated number of households per province per year in South Africa from 2002 to 2018.
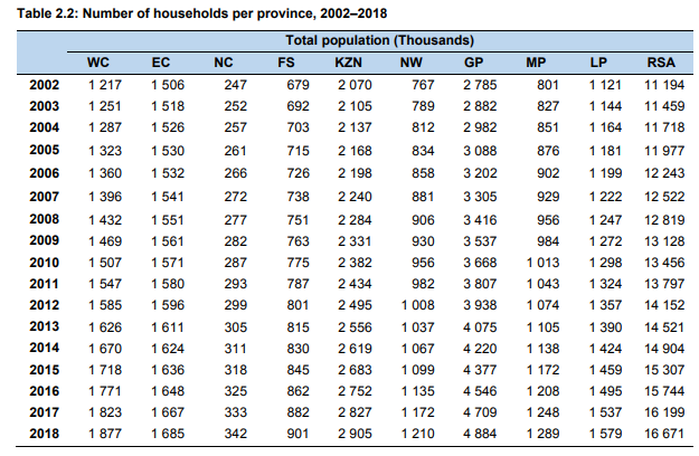
According to the table above Gauteng is the province with the highest number of households, of 4.884 million, and the Northern Cape the province with the fewest households, at just 342 000. And this is why Gauteng is the most densely populated province in South Africa while the Northern Cape is the least densely populated province in the country. Gauteng has the most number of households yet it has the smallest land area, while the Northern Cape has the least amount of households but by far the greatest land area of any of South Africa's provinces.
In total there is an estimated was an 16.671 million households in South Africa in 2018, compared to the 12.819 million households 10 years ago. Thus the number of households increased by 30.05% over the last 10 years.
In total there is an estimated was an 16.671 million households in South Africa in 2018, compared to the 12.819 million households 10 years ago. Thus the number of households increased by 30.05% over the last 10 years.
25 July 2018: Latest population mid year estimates: 57.7million people living in SA
In this update we take a look at the latest mid year population estimates published by Statistics South Africa on an interactive map which shows the population density per province over time.
The table below shows the latest population figures per province as well as the population density of each province based on the 2018 mid year population estimates provided by Statistics South Africa. Gauteng has by far the most number of people living in it, while it is by far the smallest province in South Africa. People flock to Gauteng in the hope of finding a job. But sadly for them the number of people flooding to Gauteng is causing the province's unemployment rate to rise as businesses in the province cant meet the job demands and supply of people just keep coming in.
Province |
Population |
Square Kilometers |
Population Density |
Western Cape |
6 621 103 |
129 462 |
51.1 |
Eastern Cape |
6 522 734 |
168 966 |
38.6 |
Northern Cape |
1 225 555 |
372 889 |
3.3 |
Free State |
2 954 348 |
129 825 |
22.8 |
KwaZulu-Natal |
11 384 722 |
94 361 |
120.7 |
North West |
3 978 955 |
104 882 |
37.9 |
Gauteng |
14 717 040 |
18 178 |
809.6 |
Mpumalanga |
4 523 874 |
76 495 |
59.1 |
Limpopo |
5 797 275 |
125 755 |
46.1 |
Total |
57 725 606 |
1 220 813 |
Average: 47.28 |
27 October 2017: 56.7million people living in SA
Interactive Map
|
The table to the right shows the population per province since 2002 to 2015, and the growth in the population over the same time period, both for the provinces and the country as a whole.
What is interesting to note is that only 3 provinces' population grew at the same rate or faster than country's population. They are Gauteng, Mpumalanga and Western Cape. One can assume that this is due to people migrating to these provinces in order to look for work and employment opportunities. While one would expect Gauteng and Western Cape to feature on this list, the surprise province is Mpumalanga. Carry on reading > |
Population per province:
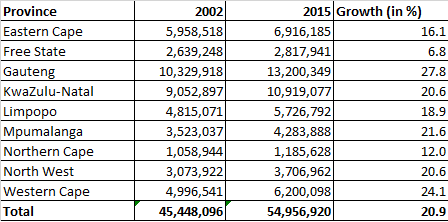
< continued from left. The Free State showed the lowest growth in population from 2002 to 2015, with it's population only increasing by 6.8% during this time period. Other laggers in terms of population growth is the Northern Cape and Limpopo
|
Updated: 2017 data
Province |
Population |
Square Kilometers |
Population Density |
Western Cape |
6 508 700 |
129 462 |
50.3 |
Eastern Cape |
6 497 100 |
168 966 |
38.5 |
Northern Cape |
1 213 500 |
372 889 |
3.3 |
Free State |
2 889 900 |
129 825 |
22.3 |
KwaZulu-Natal |
11 067 500 |
94 361 |
117.3 |
North West |
3 854 400 |
104 882 |
36.8 |
Gauteng |
14 273 800 |
18 178 |
785.2 |
Mpumalanga |
4 442 500 |
76 495 |
58 |
Limpopo |
5 774 600 |
125 755 |
45.9 |
Total |
56 522 000 |
1 220 813 |
Average: 46.30 |
The table above provides updated details regarding South Africa's population numbers, the population density per province as well as the size of each province in square kilometers. As the results show Gauteng's population density has increased from roughly 742 people per square kilometer to 785 people per square kilometer. Just showing how more and more people are flooding to Gauteng in order to look for work. However as shown in our pages regarding unemployment, Gauteng is starting to take strain and showing ever increasing unemployment rates.
From the table above it is clear that the Northern Cape is South Africa's largest province, when looking at land area, but the smallest when looking at population numbers. Gauteng has 25.1% of South Africa's total population living in it, while it only covers 1.49% of the total land area of South Africa. While the Northern Cape covers 30.5% of South Africa's total land area, only 2.15% of South Africa's population stays in the Northern Cape.
For more interesting numbers visit our new "SA By Numbers" page.
Note information about the population obtained from www.statssa.gov.za