|
Related Topics |
|
This page's sole purpose is to provide readers with interactive charts and graphics regarding South Africa's GDP (economic growth). The page will be updated on a adhoc basis as more quarter's data is released by Statistics South Africa (Stats SA).
In South Africa GDP is measured by two methods. Production method (the official GDP figure) and the expenditure method. The one measures the total value added of all goods and services produced (production method), while the other measures GDP via total spending that has taken place in the economy (expenditure method). |
|
"The Covid-19 outbreak has major health, social and economic impacts, presenting challenges in forecasting domestic economic activity. The compilation of accurate economic statistics will also remain severely challenged. The Bank currently expects GDP in 2020 to contract by 7.0%" - South African Reserve Bank
11 April 2023: South Africa's economy limping along due to loadshedding
The year on year growth rates for the various sectors of South Africa is summarised below:
South Africa's economy grew by a pathetic 0.9% over the last year if one looks at the size of the economy in the 4th quarter of 2022 and compare it to the size of the economy in the 4th quarter of 2021. The result is largely due to poor policy implementation, higher interest rates, higher inflation and loadshedding. Loadshedding means businesses cannot operate optimally, they are spending money on diesel and petrol to run generators, so money is spent inefficiently and not on high yielding areas, resulting in a economy that looks as strong as the Protea's cricket team in a cricket world cup
- Agriculture/forestry and fishing: 10.6%
- Mining: -7.1%
- Manufacturing: -1.3%
- Electricity/water and gas supply: -3.9%
- Construction: 1.2%
- Trade (wholesale, retail and motor trade): -0.2%
- Transport: 7.9%
- Finance, Real Estate and business services: 3.6%
- Government:-0.8%
- Personal services: -0.7%
- Actual GDP for Q4: 2022: 0.9%
South Africa's economy grew by a pathetic 0.9% over the last year if one looks at the size of the economy in the 4th quarter of 2022 and compare it to the size of the economy in the 4th quarter of 2021. The result is largely due to poor policy implementation, higher interest rates, higher inflation and loadshedding. Loadshedding means businesses cannot operate optimally, they are spending money on diesel and petrol to run generators, so money is spent inefficiently and not on high yielding areas, resulting in a economy that looks as strong as the Protea's cricket team in a cricket world cup
8 December 2020: South Africa's Q3:2020 GDP increases sharply 66.1% due lockdown restrictions being lifted
The quarter on quarter annualised growth rates (fancy speak for assuming growth in the industry from Q3:2020 over Q2:2020 continued for a full year) for the various sectors of South Africa is summarised below:
South Africa's economy plunged in the 2nd quarter of 2020 due to the impact of the Covid-19 pandemic and the hard lockdown (Level 5) and the slow and gradual unwinding of lockdown regulations over the last couple of months. During the 3rd quarter of 2020 most if not all restrictions were lifted and the impact on economic growth is clear. The economy has recovered sharply following the lifting of lockdown restrictions
- Agriculture/forestry and fishing: 18.5%
- Mining: 288.3%
- Manufacturing: 210.2%
- Electricity/water and gas supply: 58%
- Construction: 71.1%
- Trade (wholesale, retail and motor trade): 137%
- Transport: 79.3%
- Finance, Real Estate and business services: 16.5%
- Government: 0.9%
- Personal services: 38.6%
- Actual GDP for Q3:2020: 66.1%
South Africa's economy plunged in the 2nd quarter of 2020 due to the impact of the Covid-19 pandemic and the hard lockdown (Level 5) and the slow and gradual unwinding of lockdown regulations over the last couple of months. During the 3rd quarter of 2020 most if not all restrictions were lifted and the impact on economic growth is clear. The economy has recovered sharply following the lifting of lockdown restrictions
8 September 2020: South Africa's Q2:2020 GDP plunges by -51% due to Covid-19
The quarter on quarter annualised growth rates (fancy speak for assuming growth in the industry from Q2:2020 over Q1:2020 continued for a full year) for the various sectors of South Africa is summarised below:
South Africa's economy plunged due to the impact of the Covid-19 pandemic and the hard lockdown (Level 5) and the slow and gradual unwinding of lockdown regulations over the last couple of months. While the number is extremely bad for South Africa's economy it was not unexpected. And South Africa's economy was in deep trouble before the Covid-19 pandemic. This pandemic just made South Africa's economic hardship so much worse. This is the fourth consecutive quarter that South Africa's GDP number has been negative.
- Agriculture/forestry and fishing: 15.1%
- Mining: -73.1%
- Manufacturing: -74.9%
- Electricity/water and gas supply: -36.4%
- Construction: -76.6%
- Trade (wholesale, retail and motor trade): -67.6%
- Transport: -67.9%
- Finance, Real Estate and business services: -28.9%
- Government: -0.6%
- Personal services: -32.5%
- Actual GDP for Q2:2020: -51%
South Africa's economy plunged due to the impact of the Covid-19 pandemic and the hard lockdown (Level 5) and the slow and gradual unwinding of lockdown regulations over the last couple of months. While the number is extremely bad for South Africa's economy it was not unexpected. And South Africa's economy was in deep trouble before the Covid-19 pandemic. This pandemic just made South Africa's economic hardship so much worse. This is the fourth consecutive quarter that South Africa's GDP number has been negative.
28 May 2020: South African Reserve Banks annual GDP growth forecast evolution
In their latest financial stability review, the South African Reserve Bank covered their estimate of South Africa's GDP in more detail. Below we cover what they had to say regarding South Africa's GDP.
GDP growth in South Africa has persistently surprised to the downside in recent years. Economic activity has underperformed relative to the SARB’s expectations (and those of most analysts), resulting in continuous downward revisions to the growth outlook (see image below). At the end of 2019, the economy was in a technical recession and in the longest business cycle downturn on record. Clearly, the COVID-19 pandemic struck at a time of macroeconomic vulnerability. The SARB expects a GDP contraction of 7% in 2020, the first full-year growth decline since 2009. This represents a substantial shock to the economy, as the worst full-year GDP growth performance in South Africa’s post-World War II history was -2.1% in 1992.
GDP growth in South Africa has persistently surprised to the downside in recent years. Economic activity has underperformed relative to the SARB’s expectations (and those of most analysts), resulting in continuous downward revisions to the growth outlook (see image below). At the end of 2019, the economy was in a technical recession and in the longest business cycle downturn on record. Clearly, the COVID-19 pandemic struck at a time of macroeconomic vulnerability. The SARB expects a GDP contraction of 7% in 2020, the first full-year growth decline since 2009. This represents a substantial shock to the economy, as the worst full-year GDP growth performance in South Africa’s post-World War II history was -2.1% in 1992.
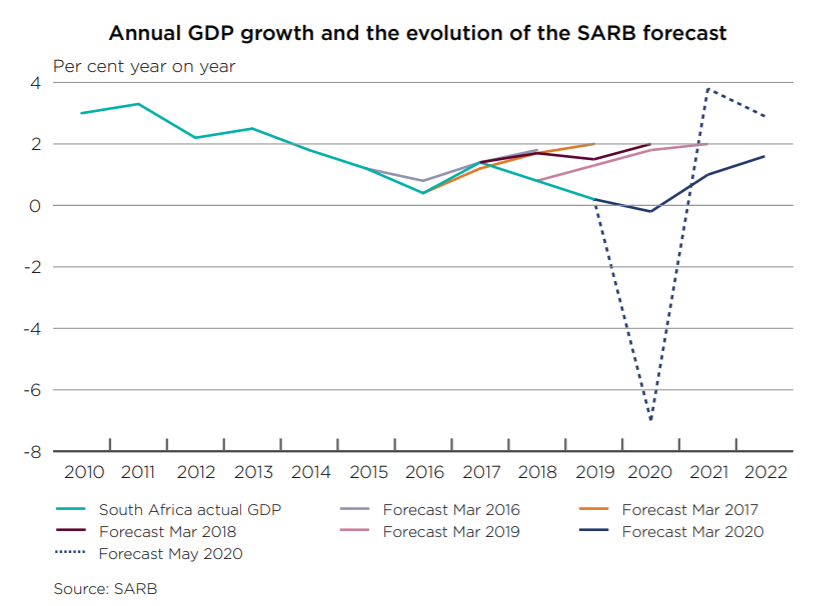
The decline in domestic growth over the past five years is mostly due to structural factors. The SARB’s estimate of the economy’s growth potential has fallen consistently, from approximately 3% for 2014 to 0.6% for 2019. Structural challenges – including skills shortages, infrastructure constraints (particularly in the energy sector) and policy uncertainty – have curbed the capacity of the economy to grow. While the SARB does anticipate an economic recovery after COVID-19 is contained, it is likely to be a relatively muted one due to these structural constraints. GDP is expected to grow by 3.8% in 2021 and 2.9% in 2022. The projection of a sharp contraction in 2020 and a relatively weak recovery implies that the level of real GDP in 2022 is likely be lower than that of 2018. As a result, financial firms could face challenges rebuilding capital buffers if they are worked down over the coming months. Should the economic downturn be deeper or more protracted than currently expected, financial stability risks will escalate.
22 May 2020: South African Reserve Bank expects the economy to contract 7% in 2020
In the South African Reserve Bank's monetary policy statement yesterday (21 May 2020), SARB stated that they now expect the economy to contract by 7% down from their April 2020 expectation of -6.1%. What follows is an extract from the monetary policy statement. The Covid-19 outbreak has major health, social and economic impacts, presenting challenges in forecasting domestic economic activity. The compilation of accurate economic statistics will also remain severely challenged. The Bank currently expects GDP in 2020 to contract by 7.0%, compared to the 6.1% contraction forecast in April. Easing of the lockdown will support growth in the near term and some high frequency activity indicators show a pickup in spending from extremely low levels. However, getting back to pre-pandemic activity levels will take time. GDP is expected to grow by 3.8% in 2021 and by 2.9% in 2022.
We do however predict it to be far worse as the slow pace from moving from Lockdown Level 4 to Level 3 and Level 2 means economic growth remains extremely subdued. We believe the South African government is to slow in reopening the economy and it its currently hurting millions of people, more than what will be affected by the Covid-19 pandemic.
We do however predict it to be far worse as the slow pace from moving from Lockdown Level 4 to Level 3 and Level 2 means economic growth remains extremely subdued. We believe the South African government is to slow in reopening the economy and it its currently hurting millions of people, more than what will be affected by the Covid-19 pandemic.
21 April 2020: President Ramaphosa announces R500 billion Covid-19 relief package
Today President Ramaphosa announced a comprehensive social and economic relief package for South Africans to fight off the effects of Covid-19 is having on citizens, businesses and South Africa's economy. The president stated that the R500 billion relief package is about 10% of South Africa's GDP. In 2019 the total worth of South Africa's economy, in current prices amounted to R5.077 trillion according to data from Statistics South Africa. So the relief package is as the president said, about 10% of the size of South Africa's economy in current prices.
9 March 2020: Relative contribution of South Africa's provinces to South Africa's GDP
The summary below shows the relative contribution (in constant prices) of the various provinces to South Africa's GDP as at the end of 2018, ranked from biggest contribution to smallest contribution.
So Gauteng is by far the biggest contributor to South Africa's GDP, with it contributing more than double than what KwaZulu-Natal, the 2nd biggest contributor to South Africa's GDP contributes. The Western Cape is the 3rd biggest contributor to South Africa's GDP. Surprising for some might be the fact that KwaZulu-Natal contributes more to South Africa's GDP than the Western Cape. But the reason for this is the significant ports infrastructure that KwaZulu-Natal possesses. The Durban harbor is the busiest part in South Africa and KwaZulu-Natal has the the Richards Bay Coal Terminal, a dedicated port for South Africa's massive coal exports. So lets take a look at which sector contributes the most to each of the provinces economy.
Read the full article here
- Gauteng: 34.94%
- KwaZulu-Natal: 16.04%
- Western Cape: 13.86%
- Eastern Cape: 7.51%
- Mpumalanga: 7.24%
- Limpopo: 7.18%
- North West: 5.89%
- Free State: 5.14%
- Northern Cape: 2.19%
So Gauteng is by far the biggest contributor to South Africa's GDP, with it contributing more than double than what KwaZulu-Natal, the 2nd biggest contributor to South Africa's GDP contributes. The Western Cape is the 3rd biggest contributor to South Africa's GDP. Surprising for some might be the fact that KwaZulu-Natal contributes more to South Africa's GDP than the Western Cape. But the reason for this is the significant ports infrastructure that KwaZulu-Natal possesses. The Durban harbor is the busiest part in South Africa and KwaZulu-Natal has the the Richards Bay Coal Terminal, a dedicated port for South Africa's massive coal exports. So lets take a look at which sector contributes the most to each of the provinces economy.
Read the full article here
3 March 2020: South Africa's GDP for Q4:2019 came in at : -1.4%
The bar chart below shows the quarter on quarter annualised growth rates for Q4:2019 compared to Q3:2019. And the number of % just shows that South Africa's economy continues to struggle to find any form of traction to grow.
The quarter on quarter annualised growth rates (fancy speak for assuming growth in the industry from Q4:2019 over Q3:2019 continued for a full year) for the various sectors of South Africa is summarised below:
South Africa's economy is in a technical recession with two quarters of negative growth. And what makes it worse for South African's is the fact the the 3rd quarter 2019 growth has been revised downwards from -0.6% to -0.8% saying the economy was even weaker than initially thought in the 3rd quarter of 2019
- Agriculture/forestry and fishing: -7.6%
- Mining: 1.8%
- Manufacturing: -1.8%
- Electricity/water and gas supply: -4.0%
- Construction: -5.9%
- Trade (wholesale, retail and motor trade): -3.8%
- Transport: -7.2%
- Finance, Real Estate and business services: 2.7%
- Government: -0.4%
- Personal services: 0.7%
- Actual GDP for Q4:2019: -1.4%
South Africa's economy is in a technical recession with two quarters of negative growth. And what makes it worse for South African's is the fact the the 3rd quarter 2019 growth has been revised downwards from -0.6% to -0.8% saying the economy was even weaker than initially thought in the 3rd quarter of 2019
21 January 2020: International Monetary Fund cuts South Africa's growth forecast
In what is not really unexpected the International Monetary Fund has cut its forecast for economic growth for South Africa for 2020 and 2021. Citing a few well known problems in South Africa as the main reason for reducing its growth forecast. Below a short extract from the IMF touching on the downward revision in its growth forecast for South Africa.
In sub-Saharan Africa, growth is expected to strengthen to 3.5 percent in 2020–21 (from 3.3 percent in 2019). The projection is 0.1 percentage point lower than in the October WEO for 2020 and 0.2 percentage point weaker for 2021. This reflects downward revisions for South Africa (where structural constraints and deteriorating public finances are holding back business confidence and private investment)
In sub-Saharan Africa, growth is expected to strengthen to 3.5 percent in 2020–21 (from 3.3 percent in 2019). The projection is 0.1 percentage point lower than in the October WEO for 2020 and 0.2 percentage point weaker for 2021. This reflects downward revisions for South Africa (where structural constraints and deteriorating public finances are holding back business confidence and private investment)
4 December 2019: South Africa's GDP for Q3:2019 came in at -0.6%
The bar chart below shows the quarter on quarter annualised growth rates for Q3:2019 compared to Q1:2019. And the number of -0.6% just shows that South Africa's economy continues to struggle to find any form of traction to grow.
The quarter on quarter annualised growth rates (fancy speak for assuming growth in the industry from Q3:2019 over Q2:2019 continued for a full year) for the various sectors of South Africa is summarised below:
South Africa's economy is like a hamster on a spinning wheel. Its going absolutely nowhere. And this has been the case for years. While other countries are growing and advancing South Africa is stagnating.
- Agriculture/forestry and fishing: -3.6%
- Mining: -6.1%
- Manufacturing: -3.9%
- Electricity/water and gas supply: -4.9%
- Construction: -2.7%
- Trade (wholesale, retail and motor trade): 2.6%
- Transport: -5.4%
- Finance, Real Estate and business services: 1.6%
- Government: 2.4%
- Personal services: 0.4%
- Actual GDP for Q3:2019: -0.6%
South Africa's economy is like a hamster on a spinning wheel. Its going absolutely nowhere. And this has been the case for years. While other countries are growing and advancing South Africa is stagnating.
3 September 2019: South Africa's GDP for Q2:2019 comes in at 3.1%
The bar chart below shows the quarter on quarter annualised growth rates for Q2:2019 compared to Q1:2019. And the number of 3.1% looks rather good. But it is rather flattering anc is more due to technical reasons than actual economic growth in South Africa
The quarter on quarter annualised growth rates (fancy speak for assuming growth in the industry from Q2:2019 over Q1:2019 continued for a full year) for the various sectors of South Africa is summarised below:
So the South African economy avoids a recession but one has to remember it is coming off a very low base considering Q1:2019 was a horror show and loadshedding affected most industries thus we are comparing subdued numbers to even more subdued numbers which creates the impression of stronger economy but in actual fact the annual growth rate of 0.9% is still well below the population growth of South Africa, so each and every citizen in South Africa is getting less and less of the economic pie
- Agriculture/forestry and fishing: -4.2%
- Mining: 14.4%
- Manufacturing: 2.1%
- Electricity/water and gas supply: 3.2%
- Construction: -1.6%
- Trade (wholesale, retail and motor trade): 3.9%
- Transport: -0.3
- Finance, Real Estate and business services: 4.1%
- Government: 3.4%
- Personal services: 0.8%
- Actual GDP for Q2:2019: 3.1%
So the South African economy avoids a recession but one has to remember it is coming off a very low base considering Q1:2019 was a horror show and loadshedding affected most industries thus we are comparing subdued numbers to even more subdued numbers which creates the impression of stronger economy but in actual fact the annual growth rate of 0.9% is still well below the population growth of South Africa, so each and every citizen in South Africa is getting less and less of the economic pie
10 June 2019: Household final consumption expenditure
In this update we take a look at household consumption expenditure which forms a large part of South Africa's economy. With household spending making up roughly 60% of the total economic size of South Africa. We focus on the main expenditure groups for South African households and not only show the relative size of the various groups to total household spending but we also take a look at the growth in the various expenditure groups over the course of the last year (after removing the effects of inflation) in order to determine which categories showed the most underlying growth. Below the relative size of the various expenditure groups (ranked from biggest to smallest):
The summary below shows the year on year growth rates in the expenditure groups after having the effects of inflation removed (in order to get to the real underlying growth rates of the various expenditure groups).
- Food and non-alcoholic beverages: 18.6%
- Transport: 14.9%
- Housing, water, electricity, gas and other fuels: 14.4%
- Miscellaneous goods and services: 11.7%
- Furnishings, household equipment, maintenance: 8.2%
- Health: 7.6%
- Recreation and culture: 5.4%
- Clothing and footwear: 5.0%
- Alcohol beverages, tobacco and narcotics: 4.5%
- Communication: 4.0%
- Education: 3.2%
- Restaurants and hotels: 2.7%
The summary below shows the year on year growth rates in the expenditure groups after having the effects of inflation removed (in order to get to the real underlying growth rates of the various expenditure groups).
- Restaurants and hotels: 4.3%
- Alcohol beverages, tobacco and narcotics: 2.9%
- Miscellaneous goods and services: 2.2%
- Health: 1.6%
- Education: 1.5%
- Food and non-alcohol beverages: 1.4%
- Furnishings, household equipment, maintenance: 0.9%
- Clothing and footwear: 0.6%
- Housing, water, electricity, gas and other fuels: 0.5%
- Total: 0.4%
- Recreation and culture: 0.2%
- Communication: -0.1%
- Transport: -4.1%
Advertisment
7 June 2019: The performance of South Africa's primary,secondary and tertiary sectors
In this update we take a look at the performance of South Africa's primary, secondary and tertiary economic sectors following the release of South Africa's Q1:2019 GDP numbers which came out far worse than most economists were expecting.
Primary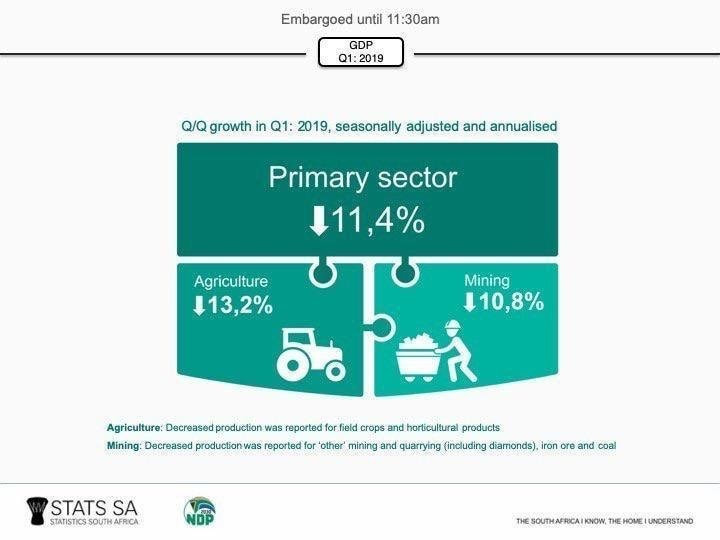
|
Secondary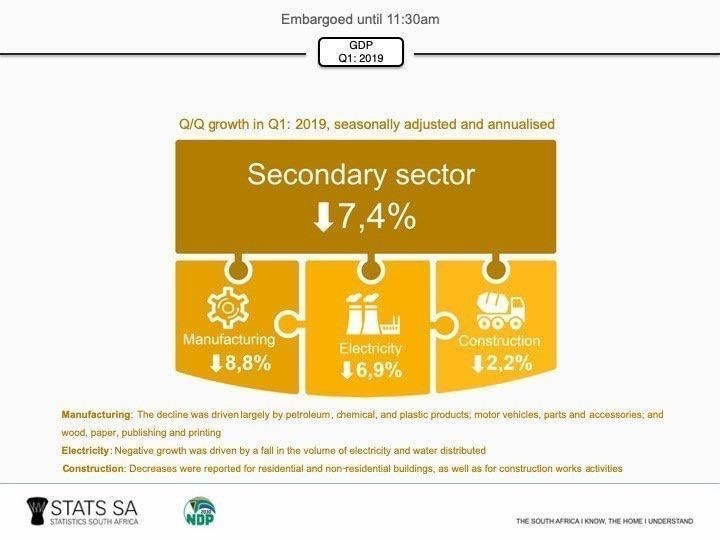
|
Tertiary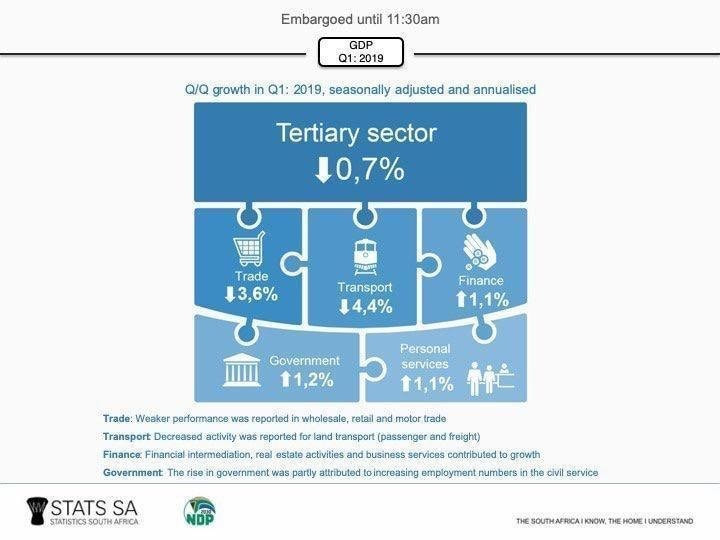
|
So how did the different industries within the Primary sector perform for Q1:2019?
So how did the different industries within the Secondary sector perform for Q1:2019?
So how did the different industries within the Tertiary sector perform for Q1:2019?
Government's growth was largely due to an increase in the number of civil servants employed. But this usually happens the quarter before elections as the IEC starts employing temporary staff and train them up to conduct elections which took place in the middle of the second quarter. The Trades which include wholesale, retail and motor trade all saw declines in Q1:2019 when compared to Q4:2018.
- Agriculture: -13.2%
- Mining: -10.8%
So how did the different industries within the Secondary sector perform for Q1:2019?
- Manufacturing: -8.8%
- Electricity: -6.9%
- Construction: -2.2%
So how did the different industries within the Tertiary sector perform for Q1:2019?
- Trade : -3.6%
- Transport: -4.4%
- Finance: 1.1%
- Government: 1.2%
- Personal services: 1.1%
Government's growth was largely due to an increase in the number of civil servants employed. But this usually happens the quarter before elections as the IEC starts employing temporary staff and train them up to conduct elections which took place in the middle of the second quarter. The Trades which include wholesale, retail and motor trade all saw declines in Q1:2019 when compared to Q4:2018.
4 June 2019: We focus on a less reported on GDP number in this update
In this update we take a look at a number that is reported far less often than the headline number used to measure economic growth each quarter. The most popular number is the quarter on quarter seasonally adjusted and annualised at constant prices. Basically economic growth in latest quarter over previous quarter expressed in a year instead of growth over a quarter and after the seasonal effects and inflation has been removed. But this numbers (the -3.2% reported for Q1:2019 in South Africa) tends to be very volatile over short periods of time.
For this reason we will focus this update on the year on year growth in GDP (constant prices and seasonally adjusted). So basically comparing the size of SA's economy in Q1:2019 with the size of SA's economy in Q1:2018. Just how much has our economy grown over the last year. The line chart below shows the year on year growth rate per quarter over time.
For this reason we will focus this update on the year on year growth in GDP (constant prices and seasonally adjusted). So basically comparing the size of SA's economy in Q1:2019 with the size of SA's economy in Q1:2018. Just how much has our economy grown over the last year. The line chart below shows the year on year growth rate per quarter over time.
And as the line chart show, South Africa's economy basically didn't grow in the last 12 months. With the growth rate over Q1:2019 over Q1:2018 being 0%. That's right, in the last 12 months South Africa's economy didn't grow at all. Its been spinning its wheels going nowhere slowly. And the year on year growth rate has been in decline for year and years and years now. Just showing how South Africa's economy hopelessly stumbles along while other emerging economies such as China and India easily achieve growth rates of 6% and 7% respectively. South Africa and its citizens is being left behind by the rest of the world. Growth and advancement is sweeping nations such as China and India yet South Africa goes nowhere and millions continue to look for jobs. The government has failed to set and implement policies that will kick start and sustain economic growth and for this reason we believe South Africa's economy will trudge along hopeless and aimlessly.
4 June 2019: South Africa's GDP for Q1:2019: -3.2%
The graphic below shows the growth per sector from Q4:2018 to Q1:2019 that has been annaulised. It is clear that loadshedding during the first quarter of 2019 had a significant impact on the growth rate of South Africa's economy
The quarter on quarter annualised growth rates (fancy speak for assuming growth in the industry from Q1:2019 over Q4:2018 continued for a full year) for the various sectors of South Africa is summarised below:
South African economists got this horribly wrong as they expected a contraction of around -1.6%, in the end the contraction ended up being twice that size. The numbers above shows that hardly any sector in the economy was spared during the first quarter of 2019. A horrible number for the South African economy and the millions of people in South Africa looking for jobs and hoping the economy starts growing so that they can find employment. The only lights in this dark economic tunnel of South Africa were the Finance, Real Estate and Business Services sector, Personal services and government grew a small amount The rest of the sectors suffered.
- Agriculture/forestry and fishing: -13.2 %
- Mining: -10.8%
- Manufacturing: -8.8%
- Electricity/water and gas supply: -6.9%
- Construction: -2.2%
- Trade (wholesale, retail and motor trade): -3.6%
- Transport: -4.4%
- Finance, Real Estate and business services: 1.1%
- Government: 1.2%
- Personal services: 1.1%
- Actual GDP for Q1:2012: -3.2%
South African economists got this horribly wrong as they expected a contraction of around -1.6%, in the end the contraction ended up being twice that size. The numbers above shows that hardly any sector in the economy was spared during the first quarter of 2019. A horrible number for the South African economy and the millions of people in South Africa looking for jobs and hoping the economy starts growing so that they can find employment. The only lights in this dark economic tunnel of South Africa were the Finance, Real Estate and Business Services sector, Personal services and government grew a small amount The rest of the sectors suffered.
28 May 2019: Global growth is slowing and it will affect South Africa
Rising interest rates in the USA will eventually start to slow down their strong growing economy, added to that the trade war between the USA and China will start to affect US and Chinese firms alike, and all of these factors will affect both the demand of products as well as the production/supply thereof. And while South Africa is not directly involved in the trade war between the US and China, and rising interest rates in the USA, higher interest rates in the USA has lead to a weaker South African Rand against the dollar, which will affect the price of imported goods, in particular final manufactured goods such as cars and machinery and it affects the price we paid for crude oil which will affect our petrol prices negatively, as can be seen with the latest petrol prices in South Africa.
So how do we know the world economy is slowing down? The image below shows the percentage change in industrial production, world trade volumes and manufacturing Purchasing Managers Index (PMI) for new orders. And they all recorded strong declines in growth rates towards the end of 2018. And this will feed through to world economies during the first quarter of 2019.
So how do we know the world economy is slowing down? The image below shows the percentage change in industrial production, world trade volumes and manufacturing Purchasing Managers Index (PMI) for new orders. And they all recorded strong declines in growth rates towards the end of 2018. And this will feed through to world economies during the first quarter of 2019.
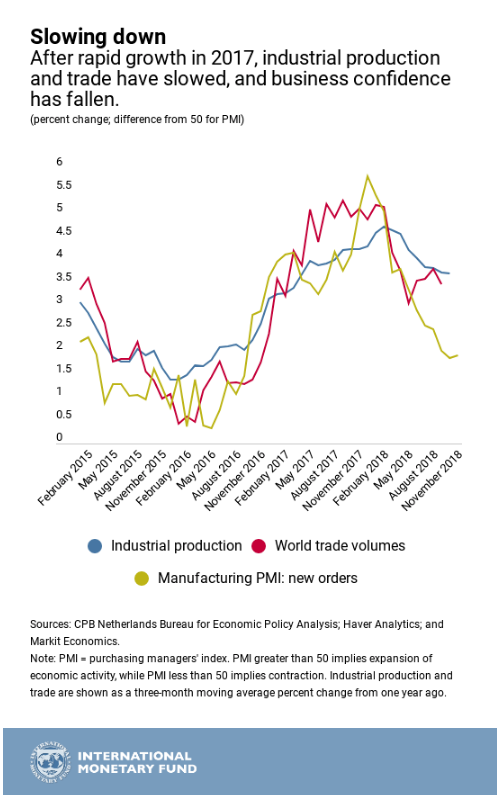
Based on the various economic indicators in South Africa for the first few months of 2019, we do predict the first quarter GDP growth of 2019 for South Africa to be a negative number. While economic indicators have recovered slightly since the end of the first quarter of 2019, this slight recovery will only start reflecting in the data for the 2nd quarter of 2019. With South Africa being a very small open economy, economic events across the world will adversely affect South Africa and South Africans whether we like it or not.
6 March 2019: Importance of the various sectors in South Africa's economy
The pie chart below shows the relative contribution of various industries to South Africa's GDP in 2018.
The summary below shows the total worth of each industry as well as its overall contribution to the total economic value of South Africa for 2018. It is ranked from biggest to smallest.
So from the above it is clear that the Finance, Real Estate and Business Services industry is by far the biggest industry in South Africa, with it making up almost a quarter of the country's total GDP in 2018. Worryingly the manufacturing industry is continuing its slide down from where it was many years ago, of around 20% to currently making up around 13.% of SA's total economy. See more on our ailing manufacturing industry here.
- Finance, real estate and business services: R640 368 228 613 (22.39%)
- General government services: R478 692 538 116 (16.74%)
- Trade, catering and accommodation: R431 668 773 614 (15.10%)
- Manufacturing: R386 883 873 805 (13.53%)
- Transport, storage and communication: R273 192 556 983 (9.55%)
- Mining and quarrying: R230 514 386 567 (8.06%)
- Personal services: R170 530 340 058 (5.96%)
- Construction: R107 665 136 484 (3.77%)
- Agriculture, forestry and fishing: R74 157 433 156 (2.59%)
- Electricity, gas and water: R65 931 792 241 (2.31%)
So from the above it is clear that the Finance, Real Estate and Business Services industry is by far the biggest industry in South Africa, with it making up almost a quarter of the country's total GDP in 2018. Worryingly the manufacturing industry is continuing its slide down from where it was many years ago, of around 20% to currently making up around 13.% of SA's total economy. See more on our ailing manufacturing industry here.
5 March 2019: SA's GDP for Q:2018 came in at : 1.4%
South Africa's GDP for the 4th quarter came in at 1.4% quarter on quarter annualised, down from the preliminary Q3:2018 GDP that came in at 2.6%. This 2.2% has been revised upwards to 2.6%. So the 1.4% quarter on quarter is pretty strong considering its 1.4% on a stronger revised Q3:2018. Exceeding the expectations as reported yesterday in which the market was expecting around 1.1% to 1.2%. The main reason for the stronger revised Q3:2018 was agriculture which was revised upwards significantly.
The quarter on quarter annualised growth rates (fancy speak for assuming growth in the industry from Q4:2018 over Q3:2018 continued for a full year) for the various sectors of South Africa is summarised below:
The numbers will not please government who is aiming for growth above 5% in order to address South Africa's persistently high unemployment rate. But it is not all doom and gloom. the 1.4% beat market expectations and is on the back of a Q3:2018 that grew faster than initially expected. So if the Q3:2018 number remained at 2.2% and wasn't revised the 1.4% for Q4:2018 would have been substantially higher.
Agriculture, Transport and Storage and the Manufacturing the fastest growing sectors during Q4:2018. A pity the fast growing agricultural sector doesn't make up a larger part of South Africa's GDP, else our numbers would have been a lot stronger in recent years. Currently the agricultural sector makes up roughly 2% of South Africa's GDP.
- Agriculture/forestry and fishing: 7.9%
- Mining: -3.8%
- Manufacturing: 4.5%
- Electricity/water and gas supply: 0.2%
- Construction: -0.7%
- Trade (wholesale, retail and motor trade): -0.7%
- Transport: 7.7%
- Finance, Real Estate and business services: 2.7%
- Government: -0.6%
- Personal services: 1.7%
- Actual GDP for Q4:2018: 1.4%
The numbers will not please government who is aiming for growth above 5% in order to address South Africa's persistently high unemployment rate. But it is not all doom and gloom. the 1.4% beat market expectations and is on the back of a Q3:2018 that grew faster than initially expected. So if the Q3:2018 number remained at 2.2% and wasn't revised the 1.4% for Q4:2018 would have been substantially higher.
Agriculture, Transport and Storage and the Manufacturing the fastest growing sectors during Q4:2018. A pity the fast growing agricultural sector doesn't make up a larger part of South Africa's GDP, else our numbers would have been a lot stronger in recent years. Currently the agricultural sector makes up roughly 2% of South Africa's GDP.
4 March 2019: GDP for Q4:2018 to be released tomorrow at 11:30
Nedbank's weekly economic commentary is predicting a 1.1% quarter on quarter growth rate for Q4:2018, which is a relatively strong pull back from the 2.2% measured on Q3:2018. According to the Buraeu of economic research, the consensus for South Africa's Q4:2018 GDP is to be 1.2% quarter on quarter annualised and seasonally adjusted. So it does look like the market is expecting a relatively low GDP growth number coming out for the end of 2018.
4 December 2018: Q3: 2018 GDP growth came in at 2.2%
So South Africa's economy exited a technical recession it was in with the quarter on quarter seasonally adjusted annualised GDP coming in at +2.2% from the -0.7% as measured initially in the 2nd quarter of 2018 (this number of -0.7% has been revised upwards slightly to -0.4%)
The quarter on quarter annualised growth rates (fancy speak for assuming growth in the industry from Q3:2018 over Q2:2018 continued for a full year) for the various sectors of South Africa is summarised below:
- Agriculture/forestry and fishing: 6.5%
- Mining: -8.8%
- Manufacturing: 7.5%
- Electricity/water and gas supply: -0.9%
- Construction: -2.7%
- Trade (wholesale, retail and motor trade): 3.2%
- Transport: 5.7%
- Finance, Real Estate and business services: 2.3%
- Government: 1.5%
- Personal services: 0.7%
- Actual GDP for Q3:2018: 2.2%
4 September 2018: Q2:2018 GDP growth came in at: -0.7%
In today's update we take a look at the GDP results released by Statistics South Africa today. The graphic below shows the quarter on quarter annualised growth rates of the South African economy per industry for Q1: 2018 and Q2:2018 as published today. Note Q1: 2018 figures have been revised from the preliminary estimates published the previous quarter.
The quarter on quarter annualised growth rates (fancy speak for assuming growth in the industry from Q2:2018 over Q1:2018 continued for a full year) for the various sectors of South Africa is summarised below:
- Agriculture/forestry and fishing: -29.2%
- Mining: 4.9%
- Manufacturing: -0.3%
- Electricity/water and gas supply: 2.1%
- Construction: 2.3%
- Trade (wholesale, retail and motor trade): -1.9%
- Transport: -4.9%
- Finance, Real Estate and business services: 1.9%
- Government: -0.5%
- Personal services: 0.8%
- Actual GDP for Q2:2018: -0.7%
5 June 2018: Q1:2018 GDP growth sits at -2.2%
In today's update we take a look at South Africa's economic growth figures as published by Statistics South Africa, today at 11:30, for the first quarter of 2018 (Q1:2018). Major growth in South Africa's economy in recent quarters have been fueled by strong growth in the agricultural sector (recovering from severe droughts). However the other industries have shown little to no growth in 2017. The graphic below provides the growth rates per industry for Q1:2018
The quarter on quarter annualised growth rates (fancy speak for assuming growth in the industry from Q1:2018 over Q4:2017 continued for a full year) for the various sectors of South Africa is summarised below:
- Agriculture/forestry and fishing: -24.2%
- Mining: -9.9%
- Manufacturing: -6.4%
- Electricity/water and gas supply: -0.5%
- Construction: -1.9%
- Trade (wholesale, retail and motor trade): -3.1%
- Transport: 0.9%
- Finance, Real Estate and business services: 1.1%
- Government: 1.8%
- Personal services: 1.2%
- Actual GDP for Q1:2018: -2.2%
6 March 2018: Updated graphics using Q4:2017 data
The graphic below shows the latest GDP data as published by Statistics South Africa per sector in the SA economy. And again it is the agricultural sector that grew by a far greater pace than any of the other sectors quarter over quarter annualised. Even though agriculture only makes up around 2.5% of South Africa's economy, it contributed 0.8% of the 3.1% economic growth experienced by the South African economy for the 4th quarter of 2017.
Actual GDP growth for Q3:2017 was revised upwards from 2% to 2.3% and the latest results for Q4:2017 shows a further improvement in South Africa's economic growth. While the growth rates are improving its not even close to enough to make a dent in South Africa's massive unemployment problem. The increasing taxes, the higher VAT rate announced in the 2018 Budget is sure to halt some of the momentum gained by the South African economy in recent quarters.
And the talk and discussions regarding expropriation of land without compensation is bound to chase foreign investors away, or keep them from investing substantial amounts of money into South Africa until they have clarity regarding the policy by the ANC (and pushed for by the marxist EFF). This will further stunt growth in a economy that is desperate for fresh and new investment so the economy can grow at a faster rate and build some momentum which will spur on further growth and investment.
Every time it looks like the SA economy is gathering some speed and momentum, politicians do their level best to slow it down, Its as if they dont want people to prosper.
Encouraging to see in the graphic above is that one of the biggest sectors in the SA economy, the finance, real estate and business services industry showed quarter on quarter growth of 2.5%. Lets hope the momentum in this sector continues as it will be a big driver of economic growth in SA going forward.
15 February 2018: Updated graphics using latest GDP data
As has been the trend in South Africa's GDP of late, the Agricultural sector is the major contributor to South Africa's economic growth at this time, with seasonally adjusted constant prices annualised growth in Agriculture sitting at 44.2% for the third quarter of 2017. This is largely due to agriculture coming off a very low base, thanks to the drought experienced in South Africa in 2015/2016. The drought lead to massive declines in outputs from agriculture, and now increased production in the sector due to significant rains in agricultural areas of South Africa is leading to output levels being far higher than the preceding years and giving rise to the significant growth rates of the sector in South Africa's GDP.
While the sector has shown significant growth in recent quarters it is still a very small sector in the overall economy.
In 2012 agriculture made up 2.34% of South Africa's GDP (when looking at industry value at 2010 constant prices). For Q3:2017, Agriculture made up 2.43% of South Africa's GDP. So while looking at the graphics below for 2017 and seeing the substantial growth experienced in the agricultural sector, its overall contribution to South Africa's GDP has remained fairly similar to the levels of say 2012. Infact the numbers below shows the agricultural sectors contribution to South Africa's GDP over the last 5 years as well as the latest quarter of 2017.
Agriculture sector size in South Africa's economy:
2012: 2.34%
2013: 2.39%
2014: 2.51%
2015: 2.34%
2016: 2.14%
Q3:2017: 2.43%
The above clearly shows that while Agricultural growth is extremely volatile and experience significant swings as shown in the quarterly graphics below, the size of the sector in SA' s overall economy is so small that even significant growth rates in the sector makes hardly any impact to the overall size of the sector in SA's economy
South Africa's GDP per quarter per industry (Production Method)
The interactive graphic below shows the GDP per quarter per industry. As users select one of the buttons in the graphic to choose a relevant quarter, the graphic will show the different growth rates of the different sectors of the economy for that quarter. Note the data is annualised. Essentially annualised data basically says if growth from the one quarter to the next were to remain the same for the next three quarter's the years growth would be as shown by the annualised growth rates.
2017
First thing readers will notice from the graphic above is that the agriculture and fishing industry has shown significant growth both in Q1:2017 and Q2:2017. This is largely a recovering taking place after the drought that South Africa experienced during 2016, so the numbers are coming off a very low base. The rest of the industries growth is pretty subdued and very close to the zero line. Indicative of South Africa's slow to no growth economic environment it finds itself in. South Africa's economy cannot continue to rely on it's primary industries to carry and grow it's economy as they are relatively small and more and more spending is heading towards the tertiary industries. What is a primary industry or tertiary industry? Below a brief description of various industry types:
- Primary industries: These usually refer to agricultural, forestry, fishing and mining industries in which the main activity is extraction of minerals or producing agricultural products. Not a lot of changes or enhancements are made to products at this level. (Agriculture and Mining falls in this category)
- Secondary industries: This refers to industries in which primary goods are used as an input in order to produce new/different goods and services. (Manufacturing, electricity, construction falls in this category)
- Tertiary industries: This typically refers to industries that supplies a service. Think Trade (retail, wholesale and motor trade) in which they supply a service by selling goods that was produced in the primary and secondary industries. Transport in which logistical services are provided. Finance and real estate services in which banking and property sales services are provided. Government services such as refuse, water etc. And personal services industries in which consumers pay for various services delivered. (Trade, Transport, Finance and real estate, Government, Personal services falls in this category)
2016
The graphic below provides an overview of South Africa's economic growth per sector per quarter for every quarter of 2016.
As mentioned in the review of the graphic on 2017, Agriculture has shown strong growth in 2017 coming off a low base caused by the drought in South Africa during 2016. The above graphic for 2016 clearly shows the decline in growth in agriculture during 2016. Mining also had a mixed year in 2016 with 2 positive quarters of growth and two negative quarters. The variability of both agriculture and the mining sectors is part of the reason we suggested that South Africa's economy should become less dependent on driving economic growth, as a lot of what affects these sectors are beyond human or government policy control. Lack of rain leading to agricultural declines cannot be prevented totally by government or policy setting, in the same way excess rain affecting coal mining cannot be stopped completely by plans and policies. Mother nature has a mind of her own and this cannot be changed, but the impact can be limited of proper plans and policies are in place and implemented properly. However there will always be this element of variability in these sectors.
The secondary and tertiary sectors are set to be more stable and easier for government to influence, steer and grow. And this is where we feel greater focus should be placed on by government. However government finds this hard to do as a large amount of their supports are employed in the agriculture and mining sectors. This any move by government that is seen as neglecting or shifting away from these industries would cost them votes at the polls (and this is obviously something they would want to avoid). And hence South Africa's continued dependence on primary industries to drive and grow SA's economy as well as trying to provide more jobs, even though these industries are shedding massive amounts of jobs.
Annual GDP growth rates
While the above looked at the quarter on quarter annualised growth rates, the graphic below takes a look at the year on year growth rates measured each quarter. And the story it tells about South Africa's economic growth rate is rather depressing, especially considering the fact that government initially had a growth target of 6% per year (now after Minister Gigaba's #MTBS2017 it seems even that pie in the sky growth target has been revised downwards to 5.4%). So in an ideal world, South Africa needs to grow at 5.4% per year in order to significantly reduce unemployment in South Africa. Take a look at the numbers below. We are not growing at anything near that pace.
In this graphic the highest year on year GDP growth rate for South Africa was recorded in March 2011, when it grew at 3.5%. Essentially from March 2010 to March 2011 South Africa's economy grew by 3.5%. Since then it has been a sad state of affairs for South Africa's economy. And while it looks like the declining trend has been reversed in the most recent quarters, the growth rates are so low, that it has little to no impact in addressing South Africa's social issues. The population is growing faster than the economy, which means that the South African economy, expressed per person in South Africa (per capita) is declining. Thus South Africans overall economic welfare is declining. And has been doing so for years. Especially when expressed in US Dollars
GDP Expenditure
This section will focus on GDP calculated from the expenditure side, and in particular on Household expenditure as this contributes roughly 70% of total spending in the economy. The bar chart below shows total household spending in South Africa on various categories. Total household spending for quarter 2:2017 (March to June 2017) amounted to just under R669billion (putting annual spending by South African households close to R2.7trillion a year.
The bulk of consumer spending as shown above is spent on Food and non-alcoholic beverages, with housing and transport making up the 2nd and 3rd biggest spending categories of household spending in South Africa.