|
Related Topics |
|
We take a look at the unemployment rate in South Africa as well as the number of discouraged work seekers. The graphs and data is as obtained from the South African Reserve Bank's quarterly bulletin for the 1st quarter 2021.
|

|
Employment
The summary below is as obtained from the South African Reserve Bank Quarterly Bulletin.
Job searching increased during the fourth quarter of 2020, following the further easing of the COVID-19-related lockdown restrictions. As a result, household-surveyed employment increased further by a seasonally adjusted 238 000 (1.6%) from the third quarter of 2020 to the fourth quarter. Nevertheless, at approximately 15.02 million according to Stats SA’s Quarterly Labour Force Survey (QLFS), the level of total employment in the fourth quarter was still well below that of a year earlier, with job losses of about 1.4 million (8.5%) over this period8 compared with a year-on-year decrease of 10.3% in the third quarter.
All four main household-surveyed subsectors registered job losses in the year to the fourth quarter of 2020; about 836 000 jobs were lost in the formal non-agricultural sector, 397 000 in the informal sector, 75 000 by private households, and 89 000 in the agricultural sector. In the fourth quarter of 2020, workers with unspecified employment contracts experienced the largest year-on-year job losses (837 000), followed by those with contracts of a more permanent nature (238 000) and those with contracts of a limited duration (177 000).
Encouragingly, on a seasonally adjusted basis, job gains were fairly wide-spread among the different industries in the fourth quarter 2020, with only 4 out of the 10 recording job losses. Employment increased the most in the community, social and personal services sector during the quarter, with 430 000 jobs created mainly through the Expanded Public Works Programme (EPWP). Other sectors that recorded job gains in the fourth quarter of 2020 were construction (76 000); trade, catering and accommodation (58 000); and transport, storage and communication (49 000). Despite the increase in real economic activity, significant job losses were registered in the finance sector (123 000) and to a lesser extent in the mining sector (33 000) in the fourth quarter of 2020.
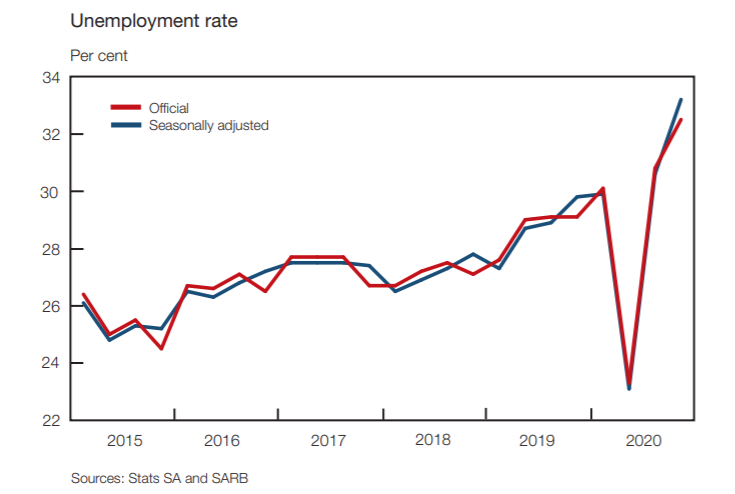
The total economically active population (labour force) increased further in the fourth quarter of 2020 with the easing of the lockdown restrictions. Unfortunately, the quarterly increase in employment of 333 000 (not seasonally adjusted) was surpassed by the increase in unemployment of 700 000 (10.7%) in the fourth quarter of 2020, and by 507 000 (7.5%) from a year earlier, which brought the number of officially unemployed persons to 7.2 million – the highest number on record. Therefore, South Africa’s official unemployment rate increased further to 32.5% in the fourth quarter of 2020, from 30.8% in the third quarter (and 29.1% a year earlier), and is now the highest since the inception of the QLFS in 2008. The seasonally adjusted unemployment rate also increased, from 30.5% in the third quarter of 2020 to 33.2% in the fourth quarter (and 29.8% a year earlier). Most of the unemployed persons were new entrants (39.4%) and job losers (31.0%), while those who last worked five years ago (that is, the long-term unemployed) comprised 19.0% of the total in the fourth quarter of 2020.
Job searching increased during the fourth quarter of 2020, following the further easing of the COVID-19-related lockdown restrictions. As a result, household-surveyed employment increased further by a seasonally adjusted 238 000 (1.6%) from the third quarter of 2020 to the fourth quarter. Nevertheless, at approximately 15.02 million according to Stats SA’s Quarterly Labour Force Survey (QLFS), the level of total employment in the fourth quarter was still well below that of a year earlier, with job losses of about 1.4 million (8.5%) over this period8 compared with a year-on-year decrease of 10.3% in the third quarter.
All four main household-surveyed subsectors registered job losses in the year to the fourth quarter of 2020; about 836 000 jobs were lost in the formal non-agricultural sector, 397 000 in the informal sector, 75 000 by private households, and 89 000 in the agricultural sector. In the fourth quarter of 2020, workers with unspecified employment contracts experienced the largest year-on-year job losses (837 000), followed by those with contracts of a more permanent nature (238 000) and those with contracts of a limited duration (177 000).
Encouragingly, on a seasonally adjusted basis, job gains were fairly wide-spread among the different industries in the fourth quarter 2020, with only 4 out of the 10 recording job losses. Employment increased the most in the community, social and personal services sector during the quarter, with 430 000 jobs created mainly through the Expanded Public Works Programme (EPWP). Other sectors that recorded job gains in the fourth quarter of 2020 were construction (76 000); trade, catering and accommodation (58 000); and transport, storage and communication (49 000). Despite the increase in real economic activity, significant job losses were registered in the finance sector (123 000) and to a lesser extent in the mining sector (33 000) in the fourth quarter of 2020.
The total economically active population (labour force) increased further in the fourth quarter of 2020 with the easing of the lockdown restrictions. Unfortunately, the quarterly increase in employment of 333 000 (not seasonally adjusted) was surpassed by the increase in unemployment of 700 000 (10.7%) in the fourth quarter of 2020, and by 507 000 (7.5%) from a year earlier, which brought the number of officially unemployed persons to 7.2 million – the highest number on record. Therefore, South Africa’s official unemployment rate increased further to 32.5% in the fourth quarter of 2020, from 30.8% in the third quarter (and 29.1% a year earlier), and is now the highest since the inception of the QLFS in 2008. The seasonally adjusted unemployment rate also increased, from 30.5% in the third quarter of 2020 to 33.2% in the fourth quarter (and 29.8% a year earlier). Most of the unemployed persons were new entrants (39.4%) and job losers (31.0%), while those who last worked five years ago (that is, the long-term unemployed) comprised 19.0% of the total in the fourth quarter of 2020.
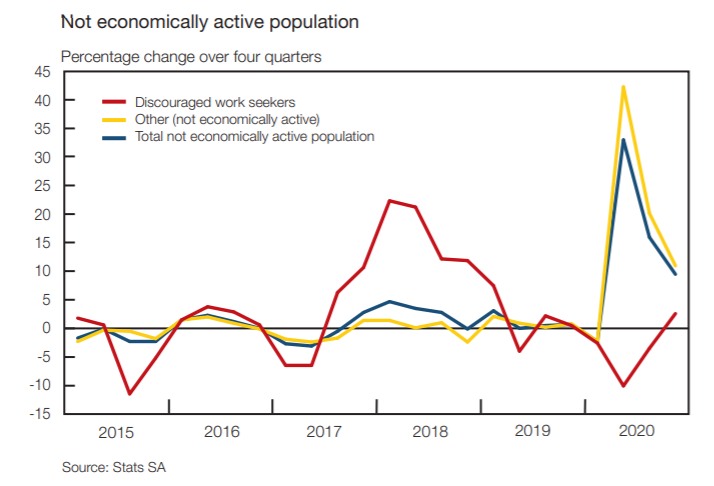
The number of discouraged work seekers increased further by 234 000 (8.7%) between the third and fourth quarter of 2020, and by about 75 000 (2.6%) in the year to the fourth quarter. Those not economically active due to ‘other reasons’, which increased significantly during the second quarter of 2020 and captures most people who could not search for work as a result of the COVID-19 lockdown restrictions, decreased further by 1.5 million (-50.9%) in the fourth quarter of 2020, following a decrease of 3.0 million (-50.4%) in the third quarter. Consequently, the total not economically active category decreased by 890 000 people (-5.0%) in the fourth quarter of 2020, despite still remaining high when compared with the pre-COVID-19 period as the return to the labour force remains gradual
The International Labour Organization (ILO) indicated that previous crises in the labour market showed that reinstating or activating inactive people into employment is more difficult than re-employing the unemployed, which suggests that the labour market recovery could be very slow and protracted. According to the ILO, most of the global employment losses in 2020 translated into rising inactivity rather than unemployment, leading to an additional 81 million people shifting to inactivity alongside a 33 million shift to unemployment. As a result, the global labour force participation rate declined by 2.2 percentage points owing to the COVID 19 pandemic, compared with only a marginal decline of 0.2 percentage points between 2008 and 20099 in the aftermath of the global financial crisis. South Africa’s labour force participation rate increased from a low of 47.3.% in the second quarter of 2020 to 56.6% in the fourth quarter, while the labour absorption rate – which represents the percentage of the working population (aged 15–64) who are employed – only improved from 36.3% to 38.2% over the same period
The phased reopening of the South African economy and resumption of economic activity in the third quarter of 2020 only marginally reversed the large formal non-agricultural sector employment losses in the second quarter. Enterprise-surveyed10 formal non-agricultural employment increased by a mere 88 900 jobs (an annualised 3.8%) in the third quarter of 2020, following substantial job losses of around 672 800 in the second quarter. The level of such employment therefore only increased slightly to an estimated 9.60 million, despite the strong and broad-based rebound in the real GVA by the formal non-agricultural sector in the third quarter. Despite the current comparatively less restrictive lockdown measures, the second and possible subsequent waves of COVID-19 infections could contribute to a fragile and uneven protracted economic recovery, with limited potential to stimulate meaningful job creation over the medium term.
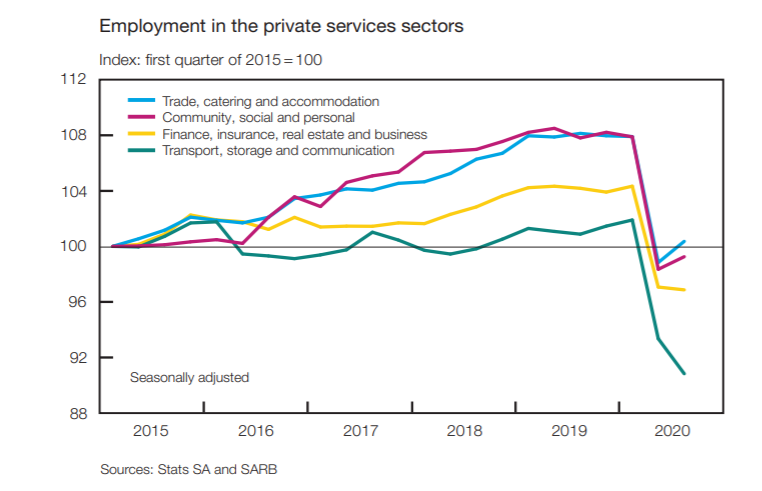
Employment in private services sector in South Africa
The trade, catering and accommodation services sector regained only 32 200 of the 191 300 jobs lost in the second quarter of 2020. The hotels and restaurants subsector registered the largest employment increase, as it started to recover from the initial lockdown during which very strict regulations were imposed on the activities of these establishments, while travel restrictions also applied. However, the reintroduction of sterner lockdown restrictions amid the second wave of COVID-19 infections presented yet another setback to the hospitality industry. Retailer confidence12 surprised on the upside in the fourth quarter of 2020, rising from 36 to 50 index points, due to improved business conditions amid eased trading restrictions and increased clientele at malls and shopping centres. Despite these gains, retailers continue to face several challenges and it remains to be seen whether the sector can sustain this momentum. Chief among these is the sustained impact of the pandemic on household and corporate balance sheets, global supply-chain constrains, lower earnings, increased credit impairments, the closure of stores and the eventual termination of the COVID-19 relief grants, which greatly benefit the retail sector.