South African Market Insights
  • Home
  • Blog
    • Blog-5Jun2018
    • Blog-18May2018
    • Blog-16May2018
    • Blog-3May2018
    • Blog-2May2018
    • Blog-30Apr2018
    • Blog-26Apr2018
    • Blog-24Apr2018
    • Blog-18Apr2018
    • Blog-17Apr2018
    • Blog-16Apr2018
    • Blog-3Apr2018
    • Blog-22Mar2018
    • Blog-20Mar2018
    • Blog-19Mar2018
    • Blog-23Oct2017
    • Blog-20Oct2017
    • Blog-11Oct2017
    • Blog-10Oct2017
    • Blog-6Oct2017
    • Blog-3Oct2017
    • Blog-2Oct2017
  • Economics
    • Rand Dollar Exchange Rate
    • South Africa's GDP
    • South Africa's Unemployment
    • SA by numbers
    • Economic Progress Index
    • Taylors Rule
    • South Africa's Formal Business Sector
    • South-Africa's-Fiscal-Policy
    • SA EU Trade Data
    • Inflation Heat Map
    • Population Density Map
    • Labour Market Dynamics
    • Estimating the Size of the Informal Economy
    • SA Consumer Spending Patterns
    • South Africa's Monetary Fiscal Policy Mix
    • GDP Animations >
      • SouthAfrica
      • WesternCape
      • EasternCape
      • NorthernCape
      • FreeState
      • KwaZuluNatal
      • NorthWest
      • Gauteng
      • Mpumalanga
      • Limpopo
    • South Africa's Economic Structure
    • South Africa's Economic History
    • South Africa's Trade Data Page
    • South Africa's Food and Beverages Sector
    • Financial Well-being of South African Companies_2015
    • SA vs the World
    • Budget Day Page (24 Feb 2016)
  • Stock in Focus
    • JSE ALSI Chart
    • Sector Comparison Page
    • JSE-Calendar-Tracker-2019
    • Adcorp (ADR)
    • Amazon (AMZN)
    • Apple (AAPL)
    • Ascendis (ASC)
    • AVI (AVI)
    • Bidvest (BVT)
    • Blue Label Telecoms (BLU)
    • Bowler Metcalf (BCF)
    • Capitec (CPI)
    • City Lodge Hotel Group
    • Clicks Group (CLS)
    • Coronation (CML)
    • Curro Holdings (COH)
    • Discovery (DSY)
    • Distell (DST)
    • EOH (EOH)
    • Famous Brands (FBR)
    • Ferrari (RACE)
    • FirstRand Group (FSR)
    • Grindrod (GND)
    • GrowthPoint (GRT)
    • Holdsport (HSP)
    • Harley-Davidson (HOG)
    • Hyprop (HYP)
    • Hyprop (HYP)_1Jun2016
    • Investec Property Fund (IPF)
    • JSE (JSE)
    • Massmart (MSM)
    • MediClinic (MEI)
    • MTN (MTN)
    • MTN (MTN)_May2016
    • Mr Price Group (MRP)
    • Mr Price Group (MRP)_8APR2016
    • Nedbank (NED)
    • OneLogix (OLG)
    • Peregrine Holdings (PGR)
    • Pick 'n Pay Stores (PIK)
    • Pioneer Foods (PFG)
    • PSG Group (PSG)
    • Quantum Foods (QFH)
    • RCL Foods (RCL)
    • Remgro (REM)
    • Richemont (CFR)
    • RMB Holdings (RMH)
    • Rolfes (RLF)
    • Sanlam (SLM)
    • Sasol (SOL)
    • Sasol (SOL)_18sep2016
    • Santova (SNV)
    • Spar Group (SPP)
    • Shoprite Holdings (SHP)
    • Spur Corporation (SUR)_7Sep2017
    • Standard Bank (SBK)
    • Steinhoff International Holdings (SNH)
    • Stor-Age (SSS)
    • Super Group (SPG)
    • Taste Holdings (TAS)_30May2016
    • The Foshini Group (TFG)
    • Value Logistics (VLE)
    • Vodacom (VOD)
    • Wilson Bayly Holmes Ovcon (WBO)
    • Woolworths (WHL)
    • Woolworths (WHL)_24Aug2017
    • Zeder (ZED)
  • Online Calculators
    • Rand Petrol Price Estimator
    • Share Valuation
    • Financial Ratios Calculator
    • GDP Growth Estimator
    • Future Value of Investment Calculator
    • Loan repayment calculator
  • Contact
  • About
  • Search

< What Does junk status really mean for SA?
SA Crime Stats >

Stellenbosch in detail

Category: Social statistics
Date: 6 July 2019

Related Topics

Third up in our new series on providing greater details regarding various districts/regions in South Africa is Stellenbosch. The area is known for its wine and its businessmen. With a group for friends and business connections often affectionately called the "Stellenbosch Mafia". The area also hosts a large university so the numbers for this region should make for interesting reading.
  • ​​Population Density Map
  • ​SOWETO in detail
  • ​Sandton in detail

Stellenbosch in numbers


According to Statistics South Africa there were 19 068 people living in Stellenbosch at the time of the last Census (2011). There were 6 382 households in Stellenbosch, 50.6% of residents aged over 20 years had a higher education, 98.4% of Stellenbosch residents had piped water inside their dwelling, while around 99.4% had electricity of lighting, and around 98.1% had access to a flush toilet connected to a sewerage system. The image below provides a graphical representation of the data mentioned above. 
Picture
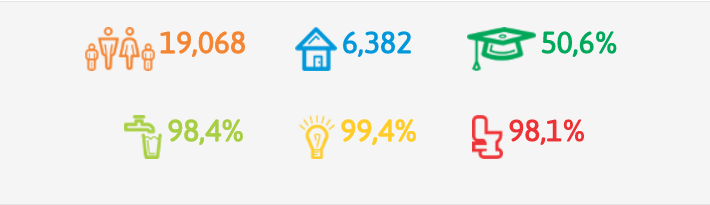
The numbers clearly show that there is not a lot of people staying within the Stellenbosch municipality. While the numbers might be small in terms of number of households and the population in the municipality, the percentage of services provided is exceptionally high. With almost 100% for piped water, electricity for lighting and flush toilets connected to a sewerage system.
Picture
​
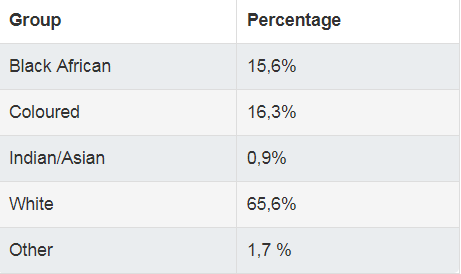
Black Africans make up only 15.6% of the population of Stellenbosch, with Coloureds making up 16.3%, Indian/Asian making up roughly 1% of Stellenbosch's total population, with the majority of Stellenbosch's population being made up by Whites. Males make up 46,9% of the population in Stellenbosch, while Females make up 53.1% of the population.

The languages spoken in Stellenbosch is clustered around English and Afrikaans (with these two languages making up almost 92% of languages spoken in Stellenbosch). IsiXhosa coming in at a very distant 3rd place with 2% of people in Stellenbosch speaking IsiXhosa.
Picture
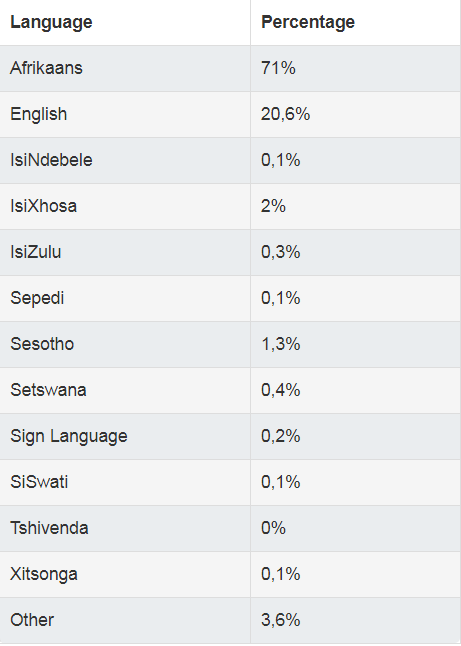
The language table above is in contrast to that of SOWETO, where IsiZulu dominated and English and Afrikaans barely featured.  Again as mentioned in the SOWETO in detail page, this is largely as a result of apartheid policies forcing Black Africans to stay on the outskirts of cities, while Stellenbosch is almost exclusively White and Coloured dominated (both race groups in the area speaking predominantly Afrikaans). The next table will take a look at the Tenure status of households in Stellenbosch. Do households, own, rent, occupy for free etc.
Picture
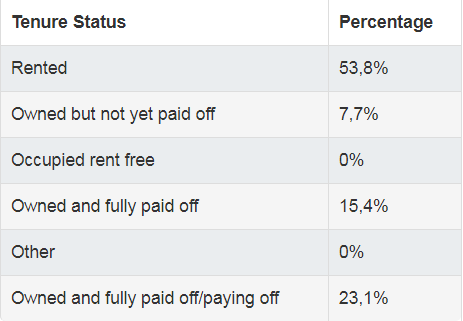
​A large portion of households in Stellenbosch rent the dwellings they stay in (53.8%), but this we will assume is due to the large number of students staying in Stellenbosch close to the the University of Stellenbosch. Interestingly no dwellings are occupied rent free in this area, while it was roughly 7% in Sandton and about 14% in SOWETO. A large chunk of households own and have fully paid of their dwellings in Stellenbosch.  So what type of household goods to households in Stellenbosch own?
Picture
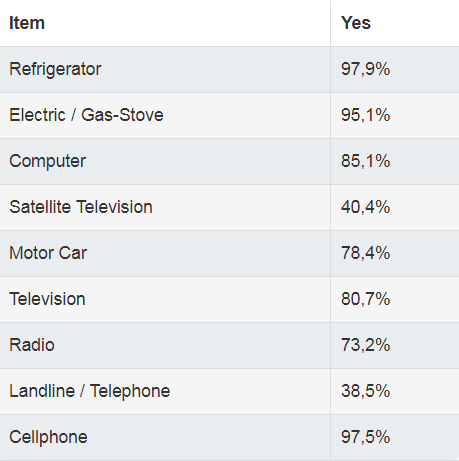
In today's smartphone driven world, it is hardly surprising to see that 97.5% of households in Stellenbosch reported to own cellphones, while only 38.5% reported to own a landline telephone. 78.4% of households in Stellenbosch reported to own a motor car, while this was 23.6% for those staying in SOWETO. Surprising is the low percentage of households in a rather affluent area that reported owning satellite television with only around 40% reporting owning satellite television.
Stellenbosch is known for being an extremely affluent area but its also known as a University town, with a large number of students staying in the area. The income earned groupings should therefore be a story of two tales. Students who earn nothing and large cluster of households that earn vast sums of money from business activities.
Picture
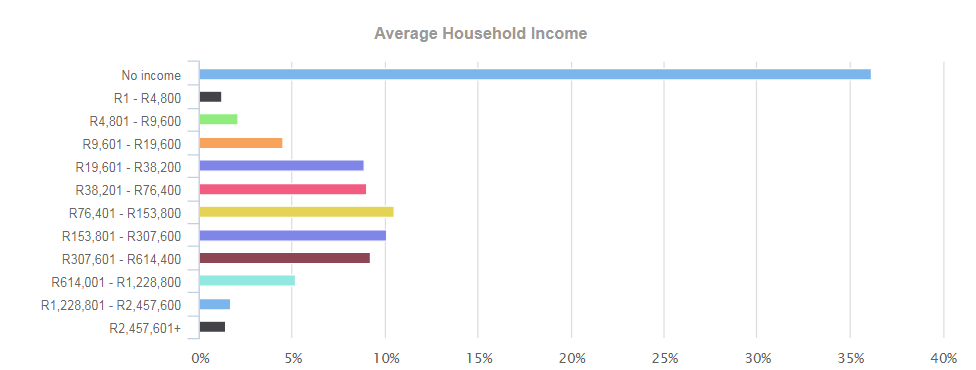
Around 37% of households in Stellenbosch reported to earn no income, only around 7% of households in Sandton reported the same. But this was expected as mentioned there is a large number of students staying int he municipality. If the no income percentage is ignored, Stellenbosch would have around 29% of their income earners earn more than R307 600 a year. Which is a relatively high percentage. But not close to the near 50% of income earners staying in Sandton earning more than R307 600 a year.
As mentioned in the introduction all data used in this article was obtained from Statistics South Africa

Data sources:

https://www.statssa.gov.za


Related Topics

  • Population Density Map
  • ​SOWETO in detail
  • ​Sandton in detail


​Homepage

Economics Page
Stock in Focus Page


​About


Contact Us

Copyright © 2015
  • Home
  • Blog
    • Blog-5Jun2018
    • Blog-18May2018
    • Blog-16May2018
    • Blog-3May2018
    • Blog-2May2018
    • Blog-30Apr2018
    • Blog-26Apr2018
    • Blog-24Apr2018
    • Blog-18Apr2018
    • Blog-17Apr2018
    • Blog-16Apr2018
    • Blog-3Apr2018
    • Blog-22Mar2018
    • Blog-20Mar2018
    • Blog-19Mar2018
    • Blog-23Oct2017
    • Blog-20Oct2017
    • Blog-11Oct2017
    • Blog-10Oct2017
    • Blog-6Oct2017
    • Blog-3Oct2017
    • Blog-2Oct2017
  • Economics
    • Rand Dollar Exchange Rate
    • South Africa's GDP
    • South Africa's Unemployment
    • SA by numbers
    • Economic Progress Index
    • Taylors Rule
    • South Africa's Formal Business Sector
    • South-Africa's-Fiscal-Policy
    • SA EU Trade Data
    • Inflation Heat Map
    • Population Density Map
    • Labour Market Dynamics
    • Estimating the Size of the Informal Economy
    • SA Consumer Spending Patterns
    • South Africa's Monetary Fiscal Policy Mix
    • GDP Animations >
      • SouthAfrica
      • WesternCape
      • EasternCape
      • NorthernCape
      • FreeState
      • KwaZuluNatal
      • NorthWest
      • Gauteng
      • Mpumalanga
      • Limpopo
    • South Africa's Economic Structure
    • South Africa's Economic History
    • South Africa's Trade Data Page
    • South Africa's Food and Beverages Sector
    • Financial Well-being of South African Companies_2015
    • SA vs the World
    • Budget Day Page (24 Feb 2016)
  • Stock in Focus
    • JSE ALSI Chart
    • Sector Comparison Page
    • JSE-Calendar-Tracker-2019
    • Adcorp (ADR)
    • Amazon (AMZN)
    • Apple (AAPL)
    • Ascendis (ASC)
    • AVI (AVI)
    • Bidvest (BVT)
    • Blue Label Telecoms (BLU)
    • Bowler Metcalf (BCF)
    • Capitec (CPI)
    • City Lodge Hotel Group
    • Clicks Group (CLS)
    • Coronation (CML)
    • Curro Holdings (COH)
    • Discovery (DSY)
    • Distell (DST)
    • EOH (EOH)
    • Famous Brands (FBR)
    • Ferrari (RACE)
    • FirstRand Group (FSR)
    • Grindrod (GND)
    • GrowthPoint (GRT)
    • Holdsport (HSP)
    • Harley-Davidson (HOG)
    • Hyprop (HYP)
    • Hyprop (HYP)_1Jun2016
    • Investec Property Fund (IPF)
    • JSE (JSE)
    • Massmart (MSM)
    • MediClinic (MEI)
    • MTN (MTN)
    • MTN (MTN)_May2016
    • Mr Price Group (MRP)
    • Mr Price Group (MRP)_8APR2016
    • Nedbank (NED)
    • OneLogix (OLG)
    • Peregrine Holdings (PGR)
    • Pick 'n Pay Stores (PIK)
    • Pioneer Foods (PFG)
    • PSG Group (PSG)
    • Quantum Foods (QFH)
    • RCL Foods (RCL)
    • Remgro (REM)
    • Richemont (CFR)
    • RMB Holdings (RMH)
    • Rolfes (RLF)
    • Sanlam (SLM)
    • Sasol (SOL)
    • Sasol (SOL)_18sep2016
    • Santova (SNV)
    • Spar Group (SPP)
    • Shoprite Holdings (SHP)
    • Spur Corporation (SUR)_7Sep2017
    • Standard Bank (SBK)
    • Steinhoff International Holdings (SNH)
    • Stor-Age (SSS)
    • Super Group (SPG)
    • Taste Holdings (TAS)_30May2016
    • The Foshini Group (TFG)
    • Value Logistics (VLE)
    • Vodacom (VOD)
    • Wilson Bayly Holmes Ovcon (WBO)
    • Woolworths (WHL)
    • Woolworths (WHL)_24Aug2017
    • Zeder (ZED)
  • Online Calculators
    • Rand Petrol Price Estimator
    • Share Valuation
    • Financial Ratios Calculator
    • GDP Growth Estimator
    • Future Value of Investment Calculator
    • Loan repayment calculator
  • Contact
  • About
  • Search