South African Market Insights
  • Home
  • Blog
    • Blog-5Jun2018
    • Blog-18May2018
    • Blog-16May2018
    • Blog-3May2018
    • Blog-2May2018
    • Blog-30Apr2018
    • Blog-26Apr2018
    • Blog-24Apr2018
    • Blog-18Apr2018
    • Blog-17Apr2018
    • Blog-16Apr2018
    • Blog-3Apr2018
    • Blog-22Mar2018
    • Blog-20Mar2018
    • Blog-19Mar2018
    • Blog-23Oct2017
    • Blog-20Oct2017
    • Blog-11Oct2017
    • Blog-10Oct2017
    • Blog-6Oct2017
    • Blog-3Oct2017
    • Blog-2Oct2017
  • Economics
    • Rand Dollar Exchange Rate
    • South Africa's GDP
    • South Africa's Unemployment
    • SA by numbers
    • Economic Progress Index
    • Taylors Rule
    • South Africa's Formal Business Sector
    • South-Africa's-Fiscal-Policy
    • SA EU Trade Data
    • Inflation Heat Map
    • Population Density Map
    • Labour Market Dynamics
    • Estimating the Size of the Informal Economy
    • SA Consumer Spending Patterns
    • South Africa's Monetary Fiscal Policy Mix
    • GDP Animations >
      • SouthAfrica
      • WesternCape
      • EasternCape
      • NorthernCape
      • FreeState
      • KwaZuluNatal
      • NorthWest
      • Gauteng
      • Mpumalanga
      • Limpopo
    • South Africa's Economic Structure
    • South Africa's Economic History
    • South Africa's Trade Data Page
    • South Africa's Food and Beverages Sector
    • Financial Well-being of South African Companies_2015
    • SA vs the World
    • Budget Day Page (24 Feb 2016)
  • Stock in Focus
    • JSE ALSI Chart
    • Sector Comparison Page
    • JSE-Calendar-Tracker-2019
    • Adcorp (ADR)
    • Amazon (AMZN)
    • Apple (AAPL)
    • Ascendis (ASC)
    • AVI (AVI)
    • Bidvest (BVT)
    • Blue Label Telecoms (BLU)
    • Bowler Metcalf (BCF)
    • Capitec (CPI)
    • City Lodge Hotel Group
    • Clicks Group (CLS)
    • Coronation (CML)
    • Curro Holdings (COH)
    • Discovery (DSY)
    • Distell (DST)
    • EOH (EOH)
    • Famous Brands (FBR)
    • Ferrari (RACE)
    • FirstRand Group (FSR)
    • Grindrod (GND)
    • GrowthPoint (GRT)
    • Holdsport (HSP)
    • Harley-Davidson (HOG)
    • Hyprop (HYP)
    • Hyprop (HYP)_1Jun2016
    • Investec Property Fund (IPF)
    • JSE (JSE)
    • Massmart (MSM)
    • MediClinic (MEI)
    • MTN (MTN)
    • MTN (MTN)_May2016
    • Mr Price Group (MRP)
    • Mr Price Group (MRP)_8APR2016
    • Nedbank (NED)
    • OneLogix (OLG)
    • Peregrine Holdings (PGR)
    • Pick 'n Pay Stores (PIK)
    • Pioneer Foods (PFG)
    • PSG Group (PSG)
    • Quantum Foods (QFH)
    • RCL Foods (RCL)
    • Remgro (REM)
    • Richemont (CFR)
    • RMB Holdings (RMH)
    • Rolfes (RLF)
    • Sanlam (SLM)
    • Sasol (SOL)
    • Sasol (SOL)_18sep2016
    • Santova (SNV)
    • Spar Group (SPP)
    • Shoprite Holdings (SHP)
    • Spur Corporation (SUR)_7Sep2017
    • Standard Bank (SBK)
    • Steinhoff International Holdings (SNH)
    • Stor-Age (SSS)
    • Super Group (SPG)
    • Taste Holdings (TAS)_30May2016
    • The Foshini Group (TFG)
    • Value Logistics (VLE)
    • Vodacom (VOD)
    • Wilson Bayly Holmes Ovcon (WBO)
    • Woolworths (WHL)
    • Woolworths (WHL)_24Aug2017
    • Zeder (ZED)
  • Online Calculators
    • Rand Petrol Price Estimator
    • Share Valuation
    • Financial Ratios Calculator
    • GDP Growth Estimator
    • Future Value of Investment Calculator
    • Loan repayment calculator
  • Contact
  • About
  • Search

< Shoprite
The Foshini Group >

Spur Corporation (SUR) stock valuation on 19 March 2018

Category: Financial markets and Spur Corporation
Date: 19 March 2018

Price at time of writing: R27.00

Spur Corporation logo and stock valuation

Related Topics

  • Famous Brands
  • Spur_Sep2017

For the latest on Spur Corporation click here


Background and overview of Spur Corporation (SUR)
Spur Corporation consists of Spur International, Spur Steak Ranches, Panarottis Pizza Pasta, John Dory’s Fish, Grill & Sushi, Captain DoRegos, The Hussar Grill and a 50% stake of RocoMamas. Spur Corporation is discussed on greater detail below.  

Spur Corporation owns a number of household brands, most notably Spur Steak Ranches, Panarottis Pizza Pasta and John Dory's. They have however over the last couple of years, acquired a number of lesser known brands. With the idea being that Spur Corporation can make the smaller brands expand and grow at a significant rate, using Spur's years of know how and capital backing.

Spur has been known over the years, to rather focus on organic growth (growing the companies they do have) instead of growth by acquisition. Famous Brands (FBR), another listed food and restaurant company, has followed the opposite approach. They have been on a shopping spree of note, but this has come back to bite Famous Brands as they losing out big time with Gourmet Burger Kitchen in the UK.

But in recent times it seems like the two companies have traded places. Spur has been buying companies (including RocoMama's, The Hassar Grill and Captain Dorego's), while FBR has slammed the brakes on their buying spree especially considering the hole GBK is burning in their financials.

The picture below shows all the Spur Corporation Brands:
Picture
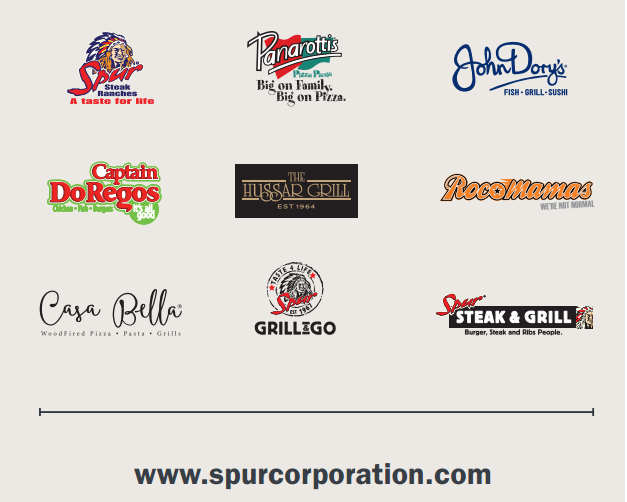
The image shows all the logos of Spur Corporation's brands, which include RocoMamas and Casa Bella
​​The graphic below shows the share price performance of Spur Corporation over the last 4 years. Note the graphic is interactive, as users can chose the dates, change the colours, download the image or the data used.

SUR share price history

Percent change:


The graphic above shows Spur's share price history over the last 4 years. Users can change the colours on the chart and zoom in and out and the graphic will recalculate the return over the user selected period as well as download the data should users want it.
Financial review:
Starting our financial review, we will take a look at SUR's income statement via the funnel chart below. This hould give readers a good idea of the revenue earned, expenses, taxes and net profits made (if any).
​Scroll over or click on the funnel chart to get more details of SURs latest financial results
funnel | amCharts

From the funnel chart below it is clear that SUR does make a fair amount of money (net profits being reflected by the green part of the funnel chart0 based on their turnover received (light blue part of funnel chart). SUR sits on a net profit margin of just under 29%, I.e for every R100 received by the group, they walk away with net profit of R28.60 after paying all their bills and taxes.

Even though the sector they operate in currently is under severe pressure as consumers cannot afford continued take outs and sit down dinners, Spur numbers earned are extremely strong. But this is largely due to a few new brands under their umbrella that has performed exceptionally well, such as RocoMamas and The Hassar Grill.
​The graphic below shows the contribution of Spur's holdings to their turnover/revenue and contributions to pre tax profits. Due to losses from certain divisions the pie chart representing the contributions to operating profits only shows divisions that made profits and their relative contributions to such profits (Captain Dorego's loss is shown as a null in the 2nd pie charts).

​Out of total profit making divisions, Spur steak ranches contributes 57% of the total operating profits made by all profitable divisions, even though it only contributes around 31% to revenues. Spur Steak ranches will be the main driver of revenues and profit for Spur corporation for the foreseeable future due to its massive footprint and name in South Africa
3D donut | amCharts

While the above pie chart shows that the majority of Spur Corporation's revenue and operating profits are earned by Spur Steak Ranches, significant contributions are being made by RocoMamas, with it making up almost 8% of the group's operating profits, which is more profits for the group than long established brands such as Panarotti's Pizza Pasta and John Dory's are bringing in for Spur Corporation. Just showing what a massive success RocoMamas has been since coming into the scene a few years ago. And what a gem of a buy it turned out to be for Spur.

Below a summary of the contribution to Spur Corporations operating profits per brand:
  • Spur Steak Ranches: 56.2%
  • Manufacturing and Distribution: 20.9%
  • Pizza Pasta (Panarotti's): 7.2%
  • The Hassar Grill: 1.6%
  • RocoMamas: 7.9%
  • Captain Dorego's: 0.024%
  • Other:2.9%

Valuation
chart created with amCharts | amCharts
While the consumers in South Africa are under pressure, there seems to be little stopping them from dining out more regularly and foregoing cooking at home. Spur seems to have changed their conservative organic growth strategy for a more aggressive growth by acquisition and rapid expansion strategy. They hold extremely strong brands (in particular with Spur Steak Ranches, Panarotti's and John Doy's,) and it seems in the not to distant future Rocomama's will be added to that list too since it is fast becoming a household name, with it looking set to open it's 50th store this year.

Based on Spur's current financial results and financial statements, its strong dividend yield, its current set of brands and the market they operate it, we value Spur Corporation at between R31.50 and
R31.70. This puts them on a PE ratio of 15.7 which is not the most demanding PE's around, even in a struggling sector such as the Food and Beverages Sector in South Africa. We feel the share offers good long term value at it's current price.

​We use our Share Valuation Calculator as guide to valuing shares. We believe in value investing and our above mentioned share valuation is based on the underlying fundamentals and financial statements of the stock in question.

Additional Content:

Related Topics

  • Famous Brands


​Homepage

Economics Page
Stock in Focus Page


​About


Contact Us

Copyright © 2015
  • Home
  • Blog
    • Blog-5Jun2018
    • Blog-18May2018
    • Blog-16May2018
    • Blog-3May2018
    • Blog-2May2018
    • Blog-30Apr2018
    • Blog-26Apr2018
    • Blog-24Apr2018
    • Blog-18Apr2018
    • Blog-17Apr2018
    • Blog-16Apr2018
    • Blog-3Apr2018
    • Blog-22Mar2018
    • Blog-20Mar2018
    • Blog-19Mar2018
    • Blog-23Oct2017
    • Blog-20Oct2017
    • Blog-11Oct2017
    • Blog-10Oct2017
    • Blog-6Oct2017
    • Blog-3Oct2017
    • Blog-2Oct2017
  • Economics
    • Rand Dollar Exchange Rate
    • South Africa's GDP
    • South Africa's Unemployment
    • SA by numbers
    • Economic Progress Index
    • Taylors Rule
    • South Africa's Formal Business Sector
    • South-Africa's-Fiscal-Policy
    • SA EU Trade Data
    • Inflation Heat Map
    • Population Density Map
    • Labour Market Dynamics
    • Estimating the Size of the Informal Economy
    • SA Consumer Spending Patterns
    • South Africa's Monetary Fiscal Policy Mix
    • GDP Animations >
      • SouthAfrica
      • WesternCape
      • EasternCape
      • NorthernCape
      • FreeState
      • KwaZuluNatal
      • NorthWest
      • Gauteng
      • Mpumalanga
      • Limpopo
    • South Africa's Economic Structure
    • South Africa's Economic History
    • South Africa's Trade Data Page
    • South Africa's Food and Beverages Sector
    • Financial Well-being of South African Companies_2015
    • SA vs the World
    • Budget Day Page (24 Feb 2016)
  • Stock in Focus
    • JSE ALSI Chart
    • Sector Comparison Page
    • JSE-Calendar-Tracker-2019
    • Adcorp (ADR)
    • Amazon (AMZN)
    • Apple (AAPL)
    • Ascendis (ASC)
    • AVI (AVI)
    • Bidvest (BVT)
    • Blue Label Telecoms (BLU)
    • Bowler Metcalf (BCF)
    • Capitec (CPI)
    • City Lodge Hotel Group
    • Clicks Group (CLS)
    • Coronation (CML)
    • Curro Holdings (COH)
    • Discovery (DSY)
    • Distell (DST)
    • EOH (EOH)
    • Famous Brands (FBR)
    • Ferrari (RACE)
    • FirstRand Group (FSR)
    • Grindrod (GND)
    • GrowthPoint (GRT)
    • Holdsport (HSP)
    • Harley-Davidson (HOG)
    • Hyprop (HYP)
    • Hyprop (HYP)_1Jun2016
    • Investec Property Fund (IPF)
    • JSE (JSE)
    • Massmart (MSM)
    • MediClinic (MEI)
    • MTN (MTN)
    • MTN (MTN)_May2016
    • Mr Price Group (MRP)
    • Mr Price Group (MRP)_8APR2016
    • Nedbank (NED)
    • OneLogix (OLG)
    • Peregrine Holdings (PGR)
    • Pick 'n Pay Stores (PIK)
    • Pioneer Foods (PFG)
    • PSG Group (PSG)
    • Quantum Foods (QFH)
    • RCL Foods (RCL)
    • Remgro (REM)
    • Richemont (CFR)
    • RMB Holdings (RMH)
    • Rolfes (RLF)
    • Sanlam (SLM)
    • Sasol (SOL)
    • Sasol (SOL)_18sep2016
    • Santova (SNV)
    • Spar Group (SPP)
    • Shoprite Holdings (SHP)
    • Spur Corporation (SUR)_7Sep2017
    • Standard Bank (SBK)
    • Steinhoff International Holdings (SNH)
    • Stor-Age (SSS)
    • Super Group (SPG)
    • Taste Holdings (TAS)_30May2016
    • The Foshini Group (TFG)
    • Value Logistics (VLE)
    • Vodacom (VOD)
    • Wilson Bayly Holmes Ovcon (WBO)
    • Woolworths (WHL)
    • Woolworths (WHL)_24Aug2017
    • Zeder (ZED)
  • Online Calculators
    • Rand Petrol Price Estimator
    • Share Valuation
    • Financial Ratios Calculator
    • GDP Growth Estimator
    • Future Value of Investment Calculator
    • Loan repayment calculator
  • Contact
  • About
  • Search