South Africa's formal sector employment in 2nd quarter 2022 declines
|
Category: Economics, employment and unemployment
Date: 13 October 2022 We take a look at the 2nd quarter 2022 formal sector employment numbers in South Africa as calculated and estimated by the Quarterly Employment Statistics (QES) survey from Statistics South Africa. During the quarter formal sector employment declined by 119 000 jobs.
|

|
Formal sector employment declined in Q2: 2022
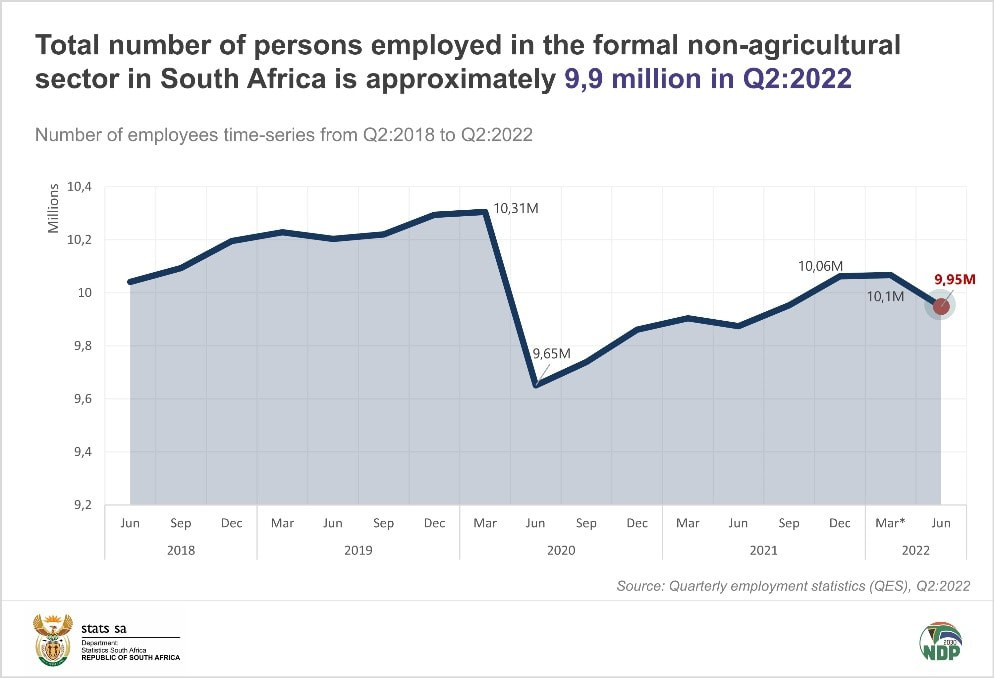
According to the Quarterly Employment Statistics (QES, Q2:2022) survey released by Statistics South Africa (Stats SA), total employment in the formal non-agricultural sector decreased by 119 000 in the second quarter of 2022, bringing the level of total employment to approximately 9,9 million. The survey showed that jobs increased by 74 000 between June 2021 and June 2022.
Total formal sector employment declines in Q2:2022
South Africa's annual inflation rate since 2009
Total employment decreased by 119 000 quarter-on-quarter, from 10 067 000 in March 2022 to 9 948 000 in June 2022. This was largely due to decreases in the following industries: community services (-100 000), business services (-15 000), construction (-13 000), manufacturing (-12 000) and electricity (-1 000).
However, there were increases in the following industries: trade (17 000), mining (4 000) and transport (1 000).
Total employment increased by 74 000 year-on-year between June 2021 and June 2022.
Full-time employment decreased by 16 000 quarter-on-quarter, from 8 842 000 in March 2022 to 8 826 000 in June 2022. This was largely due to decreases in the following industries: business services (-19 000), construction (-13 000), community services (-8 000) and electricity (-1 000).
However, there were increases in the following industry: trade (19 000), mining (4 000), manufacturing (1 000) and transport (1 000).
Full-time employment decreased by 80 000 year-on-year between June 2021 and June 2022.
Part-time employment decreased by 103 000 quarter-on-quarter, from 1 225 000 in March 2022 to 1 122 000 in June 2022. This was largely due to decreases in the following industries: community services (-92 000), manufacturing (-13 000) and trade (-2 000).
The electricity, construction and transport industries reported no quarterly change.
However, the business services industry reported a quarterly increase of 4 000 employees.
Part-time employment increased by 154 000 year-on-year between June 2021 and June 2022.
Total gross earnings paid to employees
Products with largest price increases over last year
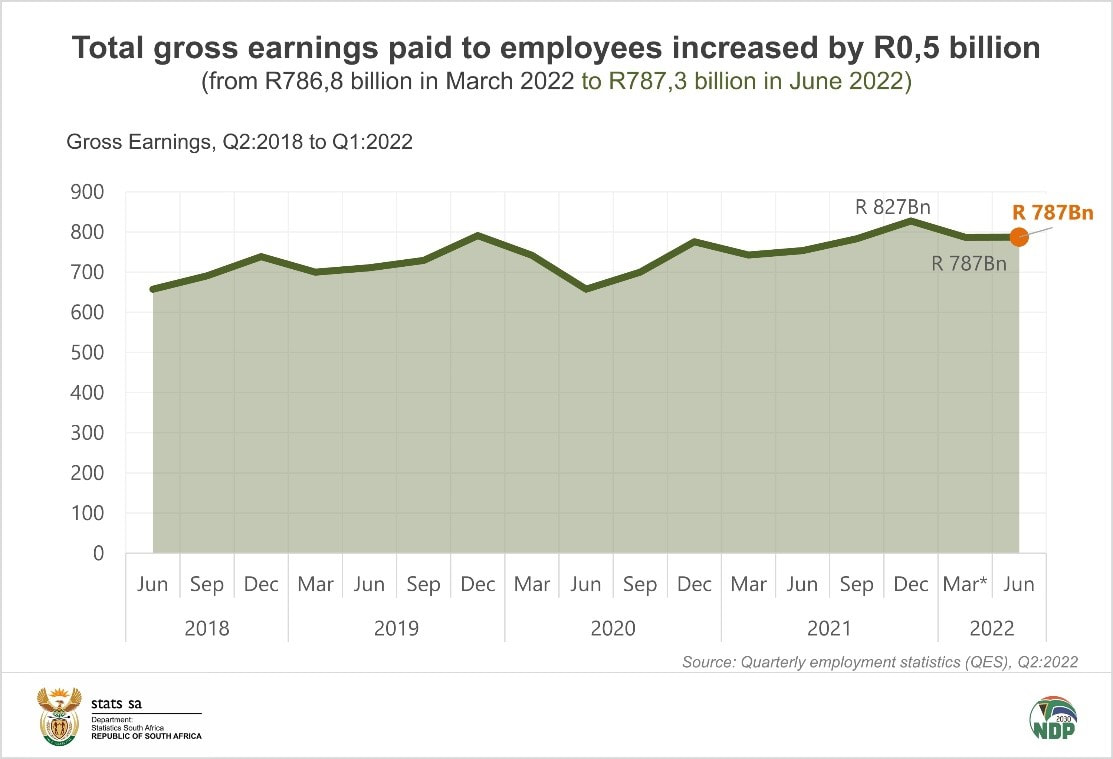
Total gross earnings paid to employees increased by R0,5 billion or 0,1% from R786,8 billion in March 2022 to R787,3 billion in June 2022. This was largely due to increases in the following industries: transport (R3,3 billion or 9,4%), community services (R2,7 billion or 1,0%), trade (R1,7 billion or 1,5%), construction (R1,7 billion or 5,2%) and mining (R0,7 billion or 1,6%).
However, there were decreases in the following industries: business services (-R9,2 billion or -4,2%), manufacturing (-R0,3 billion or -0,4%) and electricity (-R0,1 billion or -0,7%).
The year-on-year, total gross earnings increased by R33,6 billion or 4,5% between June 2021 and June 2022.
Basic salary/wages paid to employees increased by R10,3 billion or 1,5% from R706,7 billion in March 2022 to R717,0 billion in June 2022. This was largely due to increases in the following industries: business services (R4,0 billion), trade (R2,1 billion), construction (R1,6 billion), manufacturing (R1,2 billion), transport (R0,7 billion), mining (R0,7 billion) and community services (R0,1 billion).
The electricity industry, however, reported a quarterly decrease (-R9,0 million).
Year-on-year, basic salary/wages increased by R26,2 billion or 3,8% between June 2021 and June 2022.
Bonus payments paid to employees decreased by R11,9 billion or -20,0% from R59,2 billion in March 2022 to R47,4 billion in June 2022. This was largely due to decreases in the following industries: business services (-R13,7 billion), manufacturing (-R1,8 billion), trade (-R0,6 billion), construction (-R0,4 billion) and electricity (-R0,1 billion).
There were, however, increases in the following industries: transport (R2,4 billion) and community services (R2,3 billion).
Year-on-year, bonus payments increased by R5,9 billion or 14,3% between June 2021 and June 2022.
Overtime payments paid to employees increased by R2,0 billion or 9,6% from R20,9 billion in March 2022 to R22,9 billion in June 2022. This was largely due to increases in the following industries: business services (R492 million), construction (R457 million), manufacturing (R330 million), community services (R324 million), trade (R186 million), transport (R150 million) and electricity (R57 million).
Year-on-year, overtime payments increased by R1,5 billion or 7,1% between June 2021 and June 2022.
There was a quarter-on-quarter increase of 1,2% in average monthly earnings (AME) paid to employees in the formal non-agricultural sector from R23 697 in February 2022 to R24 578 in May 2022. AME increases were reported in construction (9,7%), community services (5,7%), transport (3,4%), business services (2,7%), trade (2,5%), manufacturing (2,4%), mining (2,3%) and electricity (1,0%).
Year-on-year, average monthly earnings paid to employees in the formal non-agricultural sector increased by 4,0%.