|
Related Topics |
|
In this article we compare the economies of South Africa and Chile using various economic indicators such as exchange rate performance against the US Dollar, economic growth rates, and exports and imports structures.
Chile and South Africa are located on different continents, but they are both in the Southern Hemisphere, seen as emerging markets, exports and imports structures are very similar and the behaviour of their economies over timer are very similar. South Africa has the 33rd biggest economy in the world, and Chile the 42, according to 2017 IMF estimates. |

|
Economic growth rates over time for South Africa and Chile
The line chart below shows the annual economic growth rates for both Chile and South Africa, and as the graphic shows while the annual growth rates are different, the trends followed by the respective countries economies are very similar. Since 1961, up to 2017 the two countries economic growth rates have averaged the following:
- South Africa: 3.03%
- Chile: 4.09%
So Chile has experienced a greater average annual economic growth rate over time than that of South Africa, even though their economic performance on an annual basis is far more volatile, their upswings are significantly higher than that of South Africa's economy but their downswings are far lower than that of South Africa. The graphic below takes a look at the exchange rate performance of the South African Rand and the Chilean Peso over the last 4 years.
As the graphic shows the exchange rate performance of the two countries currencies against the US dollar are very similar. The summary below shows the performance of the two countries exchange rates over various time periods such as 1 month, Year to Date (YTD) and over 4 year period:
A positive value shows a depreciation against the US dollar. So when looking at 1 month below, the Chilean Peso lost 3.3% against the US dollar while the South African Rand has lost 4.9% against the US dollar over the last month.
1 month:
A positive value shows a depreciation against the US dollar. So when looking at 1 month below, the Chilean Peso lost 3.3% against the US dollar while the South African Rand has lost 4.9% against the US dollar over the last month.
1 month:
- Chilean Peso: 3.3%
- South African Rand: 4.9%
- Chilean Peso: 7.7%
- South African Rand: 10.59%
- Chilean Peso: -0.8%
- South African Rand: 4.45%
- Chilean Peso: 17.9%
- South African Rand: 28%
1 Month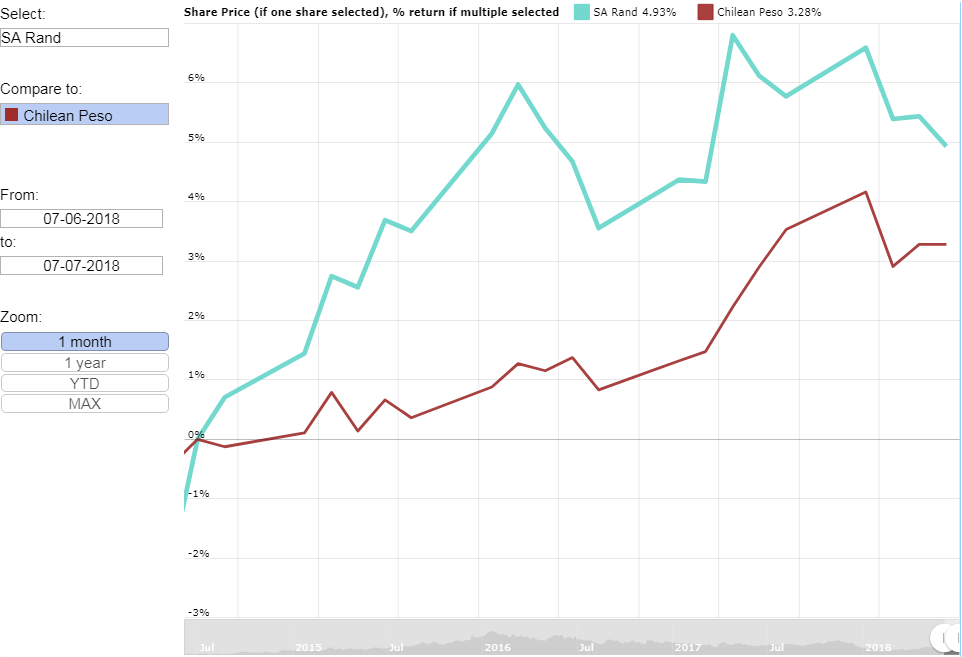
|
12 months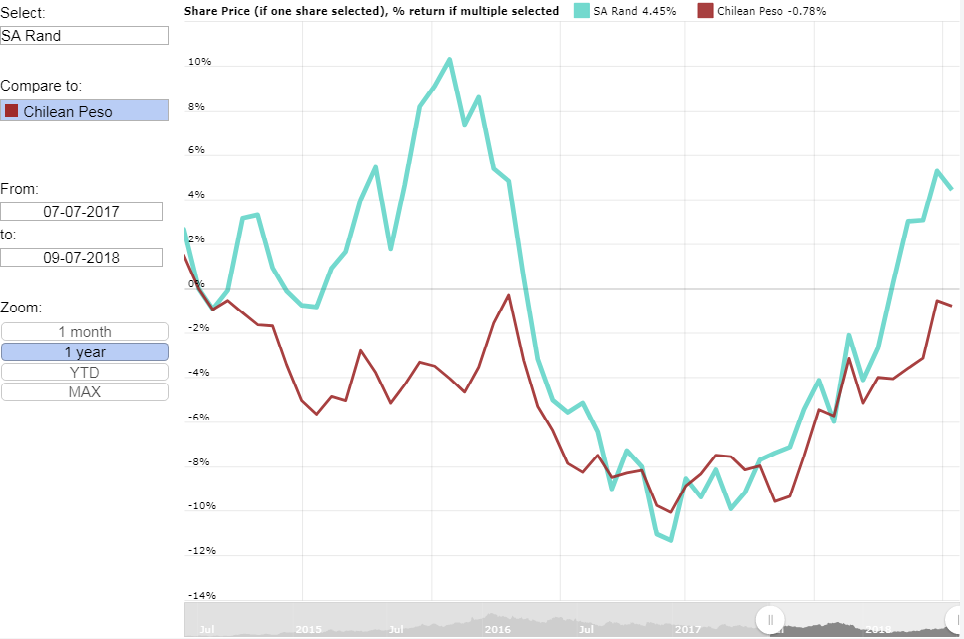
|
4 years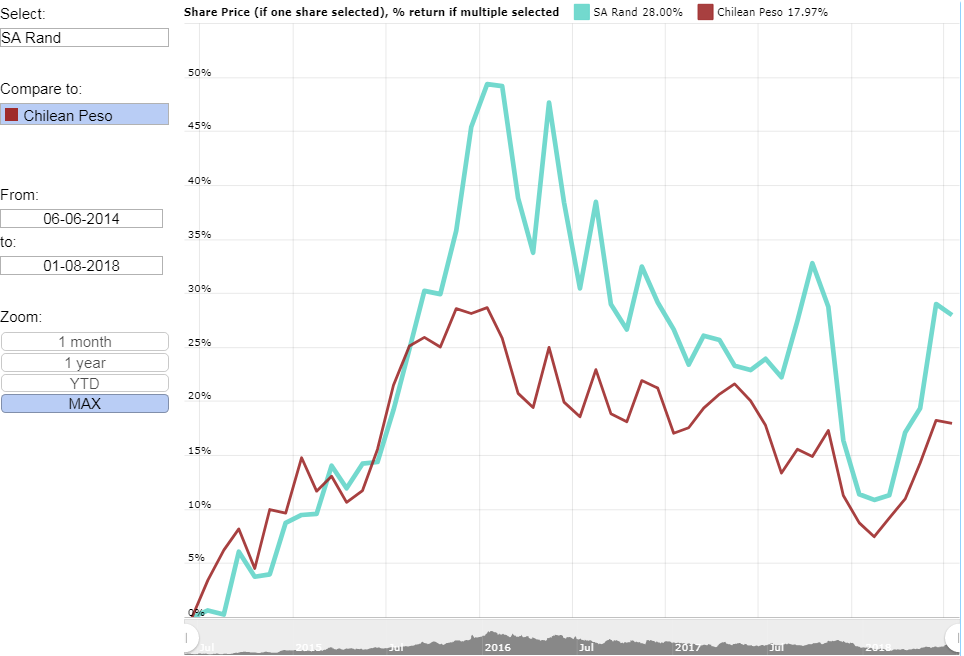
|
So similar economic growth rates, similar currency performances over time against the US dollar. What else? Well the export of two commodities by Chile and South Africa combined makes up roughly 30% of each country's total exports. The summary and table below shows the commodities in question, the US dollar value exported by the countries and the percentage if makes up of each country's total exports.
South Africa:
So while export of coal and other slags made up almost 30% of Chile's total exports, it made up almost 13% of South Africa's exports. And precious metals and stones made up almost 16% of South Africa's exports, while for Chile it only made up around 1.4% of their total exports
South Africa:
- Natural, cultured pearls; precious, semi-precious stones; precious metals, metals clad with precious metal, and articles thereof; imitation jewellery; coin $14 105 131 334 (15.98%)
- Ores, slag and ash $11 305 874 616 (12.81%)
- Natural, cultured pearls; precious, semi-precious stones; precious metals, metals clad with precious metal, and articles thereof; imitation jewellery; coin $951 364 055 (1.37%)
- Ores, slag and ash $19 484 330 588 (28.14%)
So while export of coal and other slags made up almost 30% of Chile's total exports, it made up almost 13% of South Africa's exports. And precious metals and stones made up almost 16% of South Africa's exports, while for Chile it only made up around 1.4% of their total exports
Commodity |
Chile (US $) |
South Africa (US $) |
% of Chile's total exports |
% of SA's total exports |
Natural, cultured pearls; precious, semi-precious stones; precious metals, metals clad with precious metal, and articles thereof; imitation jewellery; coin |
951 364 055 |
14 105 131 334 |
1.37 |
15.98 |
Ores, slag and ash |
19 484 330 588 |
11 305 874 616 |
28.14 |
12.81 |
So the two commodities made up 29.52% of Chile's exports in 2017, while it made up 28.79% of South Africa's exports in 2017. When looking at one of the major imports for both countries, the percentage it makes up of each country's total imports are near identical. The imported commodity in question is crude oil. The summary below shows the value in US dollars of crude imported by each country as well as the percentage it makes up of each country's total imports:
- South Africa: $12 249 078 675 (14.75%)
- Chile: $9 599 230 702 (14.75%)