South African Market Insights
  • Home
  • Blog
    • Blog-5Jun2018
    • Blog-18May2018
    • Blog-16May2018
    • Blog-3May2018
    • Blog-2May2018
    • Blog-30Apr2018
    • Blog-26Apr2018
    • Blog-24Apr2018
    • Blog-18Apr2018
    • Blog-17Apr2018
    • Blog-16Apr2018
    • Blog-3Apr2018
    • Blog-22Mar2018
    • Blog-20Mar2018
    • Blog-19Mar2018
    • Blog-23Oct2017
    • Blog-20Oct2017
    • Blog-11Oct2017
    • Blog-10Oct2017
    • Blog-6Oct2017
    • Blog-3Oct2017
    • Blog-2Oct2017
  • Economics
    • Rand Dollar Exchange Rate
    • South Africa's GDP
    • South Africa's Unemployment
    • SA by numbers
    • Economic Progress Index
    • Taylors Rule
    • South Africa's Formal Business Sector
    • South-Africa's-Fiscal-Policy
    • SA EU Trade Data
    • Inflation Heat Map
    • Population Density Map
    • Labour Market Dynamics
    • Estimating the Size of the Informal Economy
    • SA Consumer Spending Patterns
    • South Africa's Monetary Fiscal Policy Mix
    • GDP Animations >
      • SouthAfrica
      • WesternCape
      • EasternCape
      • NorthernCape
      • FreeState
      • KwaZuluNatal
      • NorthWest
      • Gauteng
      • Mpumalanga
      • Limpopo
    • South Africa's Economic Structure
    • South Africa's Economic History
    • South Africa's Trade Data Page
    • South Africa's Food and Beverages Sector
    • Financial Well-being of South African Companies_2015
    • SA vs the World
    • Budget Day Page (24 Feb 2016)
  • Stock in Focus
    • JSE ALSI Chart
    • Sector Comparison Page
    • JSE-Calendar-Tracker-2019
    • Adcorp (ADR)
    • Amazon (AMZN)
    • Apple (AAPL)
    • Ascendis (ASC)
    • AVI (AVI)
    • Bidvest (BVT)
    • Blue Label Telecoms (BLU)
    • Bowler Metcalf (BCF)
    • Capitec (CPI)
    • City Lodge Hotel Group
    • Clicks Group (CLS)
    • Coronation (CML)
    • Curro Holdings (COH)
    • Discovery (DSY)
    • Distell (DST)
    • EOH (EOH)
    • Famous Brands (FBR)
    • Ferrari (RACE)
    • FirstRand Group (FSR)
    • Grindrod (GND)
    • GrowthPoint (GRT)
    • Holdsport (HSP)
    • Harley-Davidson (HOG)
    • Hyprop (HYP)
    • Hyprop (HYP)_1Jun2016
    • Investec Property Fund (IPF)
    • JSE (JSE)
    • Massmart (MSM)
    • MediClinic (MEI)
    • MTN (MTN)
    • MTN (MTN)_May2016
    • Mr Price Group (MRP)
    • Mr Price Group (MRP)_8APR2016
    • Nedbank (NED)
    • OneLogix (OLG)
    • Peregrine Holdings (PGR)
    • Pick 'n Pay Stores (PIK)
    • Pioneer Foods (PFG)
    • PSG Group (PSG)
    • Quantum Foods (QFH)
    • RCL Foods (RCL)
    • Remgro (REM)
    • Richemont (CFR)
    • RMB Holdings (RMH)
    • Rolfes (RLF)
    • Sanlam (SLM)
    • Sasol (SOL)
    • Sasol (SOL)_18sep2016
    • Santova (SNV)
    • Spar Group (SPP)
    • Shoprite Holdings (SHP)
    • Spur Corporation (SUR)_7Sep2017
    • Standard Bank (SBK)
    • Steinhoff International Holdings (SNH)
    • Stor-Age (SSS)
    • Super Group (SPG)
    • Taste Holdings (TAS)_30May2016
    • The Foshini Group (TFG)
    • Value Logistics (VLE)
    • Vodacom (VOD)
    • Wilson Bayly Holmes Ovcon (WBO)
    • Woolworths (WHL)
    • Woolworths (WHL)_24Aug2017
    • Zeder (ZED)
  • Online Calculators
    • Rand Petrol Price Estimator
    • Share Valuation
    • Financial Ratios Calculator
    • GDP Growth Estimator
    • Future Value of Investment Calculator
    • Loan repayment calculator
  • Contact
  • About
  • Search

< South Africa's GDP
Economics Main Page >

South Africa's trade with the United Kingdom for 2019

Related Topics

  • South Africa's trade with the United States
  • South Africa's trade with Japan
  • South Africa's trade with Nigeria
Category: Imports, Exports and International Trade
Date: 25 February 2020
We take a look at the latest trade data released by South Africa's customs office the South African Revenue Service (SARS) and focus on trade between South Africa and the United Kingdom for the full year of 2019
​
Note all data from South African Revenue Service (SARS)
Big Ben in London
Big Ben in London, England

South Africa's exports to the United Kingdom

So lets start off by looking at the main product categories exported by South Africa to the United Kingdom.  The summary below shows the total value of South Africa's exports to the United Kingdom for the full year of 2019 per major product category, sorted from biggest export category to smallest (based on Rand value exported).
  • Precious Metal: R 30 256 196 961
  • Vehicles aircraft & vessels: R 16 488 728 408
  • Vegetables: R 7 262 763 973
  • Prepared foodstuffs: R 3 240 173 688
  • Machinery: R 2 464 848 023
  • Products Iron & Steel: R 2 407 481 582
  • Mineral Products: R 2 184 969 303
  • Chemicals: R 870 165 289
  • Plastics & Rubber: R 508 810 639
  • Wood pulp & paper: R 426 380 246
  • Wood Products: R 392 084 496
  • TextilesR 378 144 528
  • Photographic & medical equipment: R 264 948 732
  • Works of art: R 220 169 886
  • Stone & Glass: R 188 173 303
  • Live animals: R 177 746 438
  • Toys & Sport apparel: R 135 259 848
  • Other unclassified goods: R 70 720 164
  • Animal or vegetable fats:  62 075 788
  • Footwear: R 14 494 136
  • Raw hides & leather: R 7 930 432
  • Equipment Components: R
  • Total Exports to United Kingdom for 2019: R68 022 265 863

The treemap below represents the information above graphically
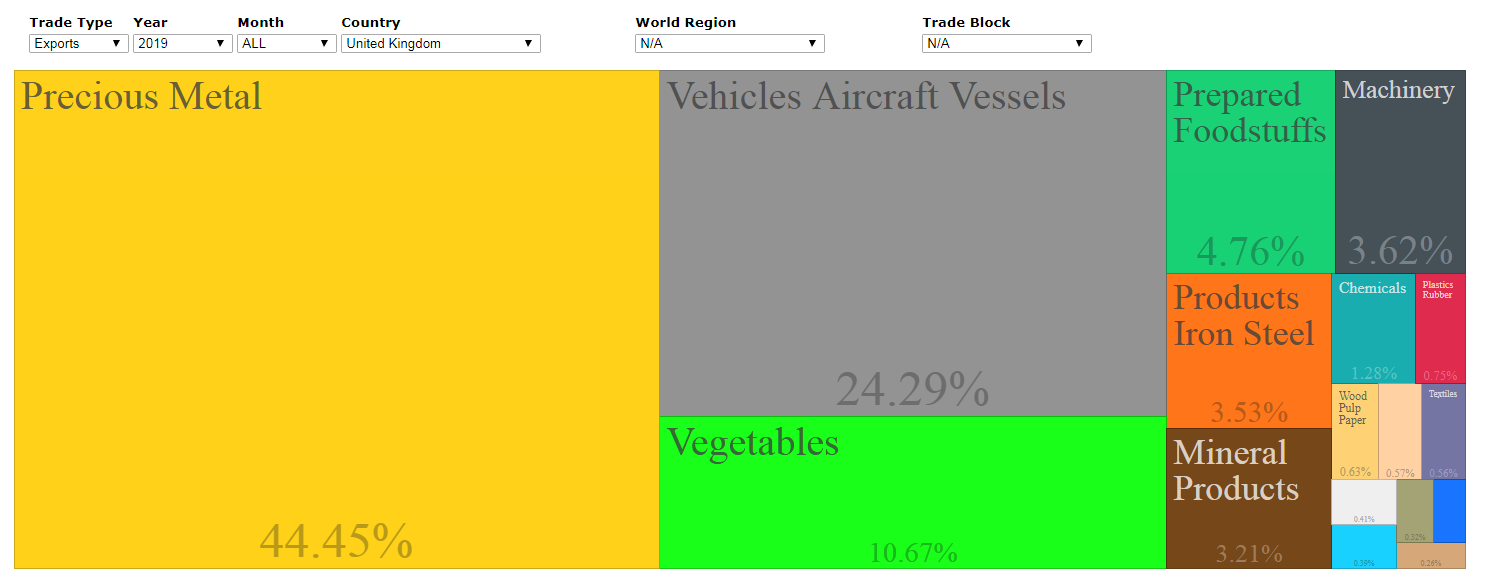
South Africa's major product exports to the United Kingdom
As the treemap shows the bulk of South Africa's exports to the United Kingdom is made up by precious metal exports with it making up almost 45% of South Africa's total exports to the United Kingdom. Vehicles, aircraft and vessels comes in as a distant 2nd place export to the United Kingdom. This is mostly made up by right hand drive vehicles manufactured in South Africa which is then exported to the United Kingdom, which uses right hand drive vehicles too. In third place is vegetables which made up just over 10% of South Africa's exports to the United Kingdom.

Advertisement (and yes South Africans can buy from Amazon as they ship to SA)

South Africa's imports from the United Kingdom

Next up we take a look at the ​main product categories imported from to the United Kingdom into South Africa.  The summary below shows the total value of South Africa's imports from the United Kingdom for the full year of 2019 per major product category, sorted from biggest import category to smallest (based on Rand value imported).
  • Wood pulp & paper: R 14 311 463 452
  • Machinery: R 7 218 388 087
  • Vehicles aircraft & vessels: R 4 412 520 797
  • Chemicals: R 4 371 396 635
  • Prepared foodstuffs: R 3 374 535 055
  • Equipment Components: R 2 240 501 931
  • Photographic & medical equipment: R 1 569 020 843
  • Plastics & Rubber: R 1 363 492 710
  • Products Iron & Steel: R 1 229 429 244
  • Toys & Sport apparel: R 469 987 681
  • Live animals: R 416 203 454
  • Mineral Products: R 408 699 215
  • Stone & Glass: R 313 959 019
  • Textiles: R 272 845 338
  • Vegetables: R 187 093 234
  • Works of art: R 118 330 111
  • Precious Metal: R 63 020 972
  • Footwear: R 53 662 674
  • Other unclassified goods: R 43 812 232
  • Raw hides & leather: R 15 641 349
  • Animal or vegetable fats: R 14 266 663
  • Wood Products:R 10 801 166
  • Total Imports from the United Kingdom for 2019: R42 479 071 862​

​
The treemap below represents the information above graphically
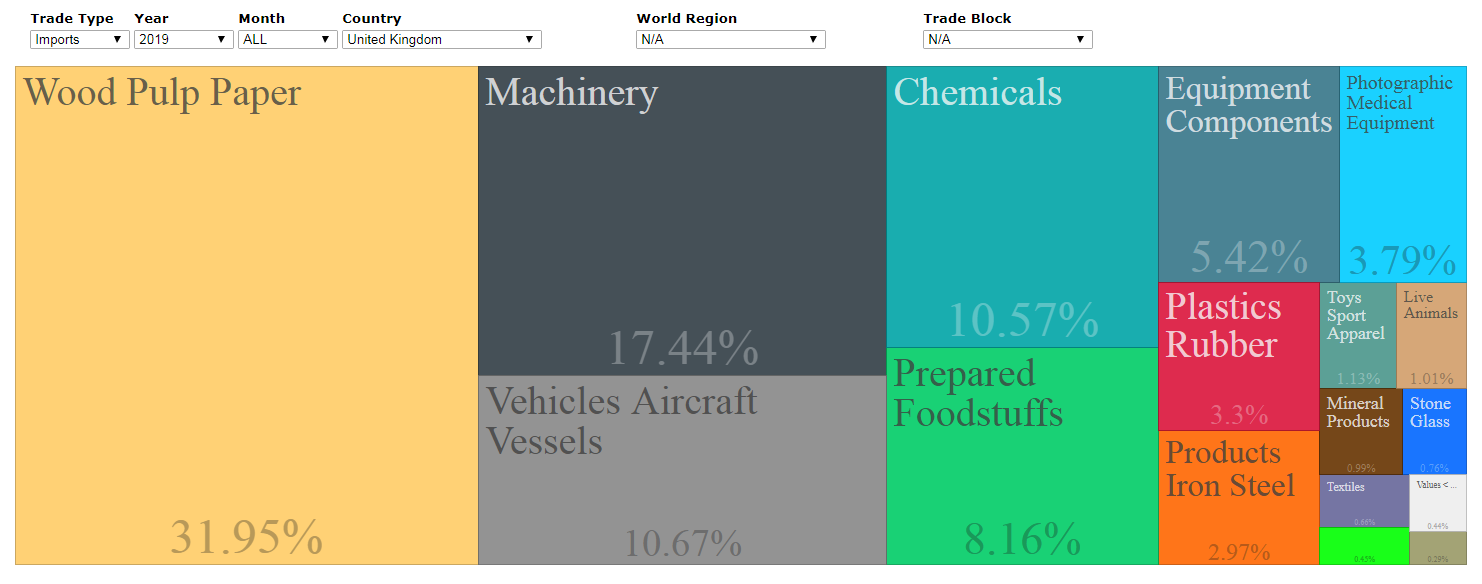
South Africa's major product imports from the United Kingdom
As the treemap above shows the biggest product import category during 2019 was wood, pulp and paper, with almost a third of South Africa's imports from the United Kingdom being made up by this category. A distant second biggest import category is Machinery with it making up just over 17% of total imports into South Africa from the United Kingdom. Vehicles, aircraft and vessels comes in a distant third place with it making up just under 11% of South Africa's imports from the United Kingdom

South Africa's trade balance per major product category traded with the United United Kingdom

The summary below shows South Africa's trade balance with the United Kingdom for the major product groupings, sorted from highest trade surplus (where South Africa exported more of a product group to the United Kingdom than what imported) to biggest trade deficit (where South Africa imported more of a major product group from the United Kingdom than what it exported to the United Kingdom.
  • Precious Metal: R 30 193 175 989
  • Vehicles aircraft & vessels: R 12 076 207 611
  • Vegetables: R 7 075 670 739
  • Mineral Products: R 1 776 270 088
  • Products Iron & Steel: R 1 178 052 338
  • Wood Products: R 381 283 330
  • Textiles: R 105 299 190
  • Works of art: R 101 839 775
  • Animal or vegetable fats: R 47 809 125
  • Other unclassified goods: R 26 907 932
  • Raw hides & leather: R -7 710 917
  • Footwear: R -39 168 538
  • Stone & Glass: R -125 785 716
  • Prepared foodstuffs: R -134 361 367
  • Live animals: R -238 457 016
  • Toys & Sport apparel: R -334 727 833
  • Plastics & Rubber: R -854 682 071
  • Photographic & medical equipment: R -1 304 072 111
  • Equipment Components: R -2 240 501 931
  • Chemicals: R -3 501 231 346
  • Machinery: R -4 753 540 064
  • Wood pulp & paper: R -13 885 083 206
  • Trade balance with United Kingdom for 2019: R25 543 194 001

Good news for South Africa is the fact that their total trade balance in 2019 with the United Kingdom amounted to R25.54 billion. So South Africa exported R25.54 billion more worth of goods to the United Kingdom than what they imported from the United Kingdom.

Newsletter Subscription:

    Please enter your email address below to subscribe to our newsletter. It will be ad hoc newsletters and we wont bombard your email inbox with emails. We will NEVER supply your contact details to any third party.

Subscribe to Newsletter

Additional content

Related Topics

  • ​South Africa's GDP
  • ​South Africa's unemployment
  • ​Employment in the gold mining industry
  • ​South Africa's manufacturing


​Homepage

Economics Page
Stock in Focus Page


​About


Contact Us

Copyright © 2015
  • Home
  • Blog
    • Blog-5Jun2018
    • Blog-18May2018
    • Blog-16May2018
    • Blog-3May2018
    • Blog-2May2018
    • Blog-30Apr2018
    • Blog-26Apr2018
    • Blog-24Apr2018
    • Blog-18Apr2018
    • Blog-17Apr2018
    • Blog-16Apr2018
    • Blog-3Apr2018
    • Blog-22Mar2018
    • Blog-20Mar2018
    • Blog-19Mar2018
    • Blog-23Oct2017
    • Blog-20Oct2017
    • Blog-11Oct2017
    • Blog-10Oct2017
    • Blog-6Oct2017
    • Blog-3Oct2017
    • Blog-2Oct2017
  • Economics
    • Rand Dollar Exchange Rate
    • South Africa's GDP
    • South Africa's Unemployment
    • SA by numbers
    • Economic Progress Index
    • Taylors Rule
    • South Africa's Formal Business Sector
    • South-Africa's-Fiscal-Policy
    • SA EU Trade Data
    • Inflation Heat Map
    • Population Density Map
    • Labour Market Dynamics
    • Estimating the Size of the Informal Economy
    • SA Consumer Spending Patterns
    • South Africa's Monetary Fiscal Policy Mix
    • GDP Animations >
      • SouthAfrica
      • WesternCape
      • EasternCape
      • NorthernCape
      • FreeState
      • KwaZuluNatal
      • NorthWest
      • Gauteng
      • Mpumalanga
      • Limpopo
    • South Africa's Economic Structure
    • South Africa's Economic History
    • South Africa's Trade Data Page
    • South Africa's Food and Beverages Sector
    • Financial Well-being of South African Companies_2015
    • SA vs the World
    • Budget Day Page (24 Feb 2016)
  • Stock in Focus
    • JSE ALSI Chart
    • Sector Comparison Page
    • JSE-Calendar-Tracker-2019
    • Adcorp (ADR)
    • Amazon (AMZN)
    • Apple (AAPL)
    • Ascendis (ASC)
    • AVI (AVI)
    • Bidvest (BVT)
    • Blue Label Telecoms (BLU)
    • Bowler Metcalf (BCF)
    • Capitec (CPI)
    • City Lodge Hotel Group
    • Clicks Group (CLS)
    • Coronation (CML)
    • Curro Holdings (COH)
    • Discovery (DSY)
    • Distell (DST)
    • EOH (EOH)
    • Famous Brands (FBR)
    • Ferrari (RACE)
    • FirstRand Group (FSR)
    • Grindrod (GND)
    • GrowthPoint (GRT)
    • Holdsport (HSP)
    • Harley-Davidson (HOG)
    • Hyprop (HYP)
    • Hyprop (HYP)_1Jun2016
    • Investec Property Fund (IPF)
    • JSE (JSE)
    • Massmart (MSM)
    • MediClinic (MEI)
    • MTN (MTN)
    • MTN (MTN)_May2016
    • Mr Price Group (MRP)
    • Mr Price Group (MRP)_8APR2016
    • Nedbank (NED)
    • OneLogix (OLG)
    • Peregrine Holdings (PGR)
    • Pick 'n Pay Stores (PIK)
    • Pioneer Foods (PFG)
    • PSG Group (PSG)
    • Quantum Foods (QFH)
    • RCL Foods (RCL)
    • Remgro (REM)
    • Richemont (CFR)
    • RMB Holdings (RMH)
    • Rolfes (RLF)
    • Sanlam (SLM)
    • Sasol (SOL)
    • Sasol (SOL)_18sep2016
    • Santova (SNV)
    • Spar Group (SPP)
    • Shoprite Holdings (SHP)
    • Spur Corporation (SUR)_7Sep2017
    • Standard Bank (SBK)
    • Steinhoff International Holdings (SNH)
    • Stor-Age (SSS)
    • Super Group (SPG)
    • Taste Holdings (TAS)_30May2016
    • The Foshini Group (TFG)
    • Value Logistics (VLE)
    • Vodacom (VOD)
    • Wilson Bayly Holmes Ovcon (WBO)
    • Woolworths (WHL)
    • Woolworths (WHL)_24Aug2017
    • Zeder (ZED)
  • Online Calculators
    • Rand Petrol Price Estimator
    • Share Valuation
    • Financial Ratios Calculator
    • GDP Growth Estimator
    • Future Value of Investment Calculator
    • Loan repayment calculator
  • Contact
  • About
  • Search