|
Related Topics |
Category: Currencies and emerging markets
Date: 25 June 2019
Date: 25 June 2019
|
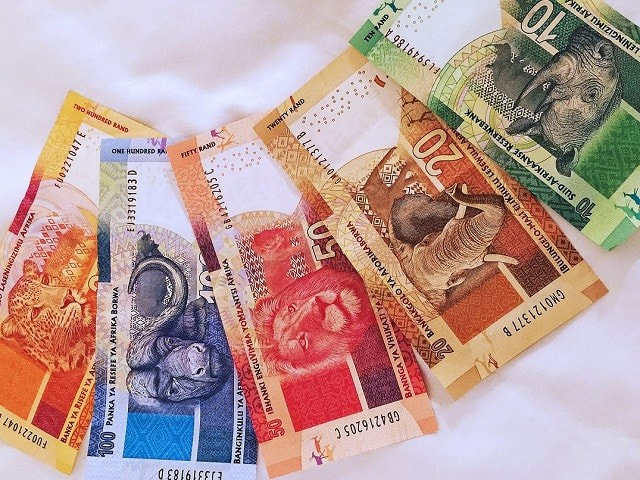
We take a look at the currency data of South Africa, Turkey and Chile supplied to us by our friends at PSG and compare these three emerging market economies currencies and their performance against the mighty US dollar over the course of the last two years. We as South Africans might be complaining about out exchange rate but just be happy its not the Turkish Lira.
|
|
So which of the currencies in question had the best performance against US dollar
So while we hinted in the introduction that South Africans would be quick to complain about the performance of its currency against the US dollar, and the knock on effects this has on South Africa's economy (higher crude oil import prices which leads to higher fuel prices which eventually drives up South Africa's levels of inflation), we should still be happy it hasn't performed like emerging market peer Turkey's currency. The graphic below in standard format shows the performance of the Rand against the US dollar for the last month. But as soon as users click on the Turkish Lira or Chilean Peso in the top left hand of the graphic the graphic adds these two currencies to the graphic and it shows its performance against the US dollar at the top of the chart. A positive percentage shows the currency weakened and a negative percentage shows the currency in question strengthened against the US dollar. Readers can also adjust the time frame on the scroll bar at the bottom of the graphic, or select one of the predetermined dates under the Zoom heading. Or readers can input their own dates (within the last two years). As soon as the dates are changed on the graphic the graphic recalculates the returns of the various currencies against the US dollar for the selected time period.
Over the last month, all three of the currencies strengthened against the US dollar. The summary below shows by how much each strengthened against the US dollar:
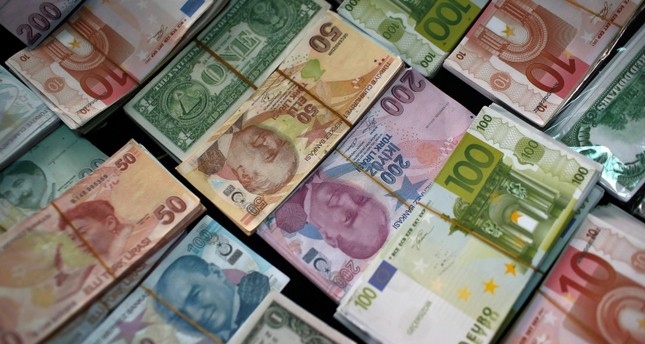
So how to interpret this? Basically the South African Rand strengthened by 0.62% against the US dollar, the Chilean Peso strengthened by 2.43% against the US dollar in the last month while the Turkish Lira strengthened by almost 4% against the US dollar in the last month. Political changes in Turkey adding fuel to their currency. Political risk and uncertainty was the main reason the currency have been struggling over the least couple of years. The image below shows various Turkish Lira notes
- South African Rand: -0.62%
- Chilean Peso: -2.43%
- Turkish Lira: -3.96%
So how to interpret this? Basically the South African Rand strengthened by 0.62% against the US dollar, the Chilean Peso strengthened by 2.43% against the US dollar in the last month while the Turkish Lira strengthened by almost 4% against the US dollar in the last month. Political changes in Turkey adding fuel to their currency. Political risk and uncertainty was the main reason the currency have been struggling over the least couple of years. The image below shows various Turkish Lira notes
The image below shows the performance of the South African Rand (ZAR), Turkish Lira (TRY) and the Chilean Peso (CLP) against the US dollar over the last 12 months. And readers will notice that the performance of the Chilean Peso and South African Rand are very similar (as both are seen as emerging market (EM) currencies they tend to move in similar fashions as news affecting one EM currency tends to affect all EM currencies. The same however cannot be said about the Turkish Lira. Political instability and President Erdogan's grip on power and dealing with critics of him in his country saw the currency being heavily punished.
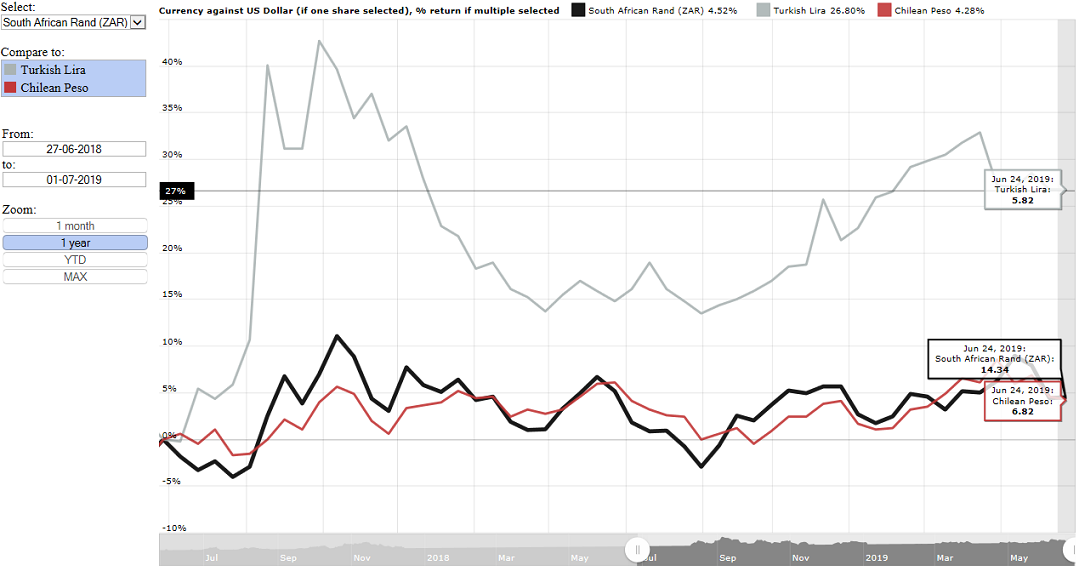
The summary below shows the performance of the South African Rand, Turkish Lira and Chilean Peso against the US dollar over the last 12 months (sorted from best performing to worst performing):
So over the last year the Chilean Peso lost 4.28% against the US Dollar, the South African Rand lost 5.52% against the US Dollar and the Turkish Lira lost an almighty 26.8% against the US Dollar. So South African's be happy the Rand didn't perform like the Turkish Lira.
The summary below shows the performance of the South African Rand, Turkish Lira and Chilean Peso against the US dollar over the last 2 years (sorted from best performing to worst performing):
So over the last two years the Chilean Peso lost just 1.49% against the US Dollar, the South African Rand lost more than 10% of its value against the greenback at 11.42% against the US Dollar and the Turkish Lira lost a whopping 62.57% of its value against the US Dollar.
- Chilean Peso: 4.28%
- South African Rand: 5.52%
- Turkish Lira: 26.8%
So over the last year the Chilean Peso lost 4.28% against the US Dollar, the South African Rand lost 5.52% against the US Dollar and the Turkish Lira lost an almighty 26.8% against the US Dollar. So South African's be happy the Rand didn't perform like the Turkish Lira.
The summary below shows the performance of the South African Rand, Turkish Lira and Chilean Peso against the US dollar over the last 2 years (sorted from best performing to worst performing):
- Chilean Peso: 1.49%
- South African Rand: 11.42%
- Turkish Lira: 62.57%
So over the last two years the Chilean Peso lost just 1.49% against the US Dollar, the South African Rand lost more than 10% of its value against the greenback at 11.42% against the US Dollar and the Turkish Lira lost a whopping 62.57% of its value against the US Dollar.
Chilean Peso
While there tends to be worries and fears around emerging market currencies, the Chilean Peso has shown itself to be rather resilient against the US dollar with it losing just 1.5% of its value against the US dollar in the last two years. While the South African Rand hasn't performed nearly as badly against the US dollar as the Turkish Lira over the last two years, it did still lose over 10% of its value against the US dollar. And this while emerging market peer Chile's Peso only lost 1.5% against the US dollar over the same time period. This is what South Africa's Rand could have achieved if political infighting in the country came to a halt, business friendly policies are implemented and the economy starts growing again. Sometimes we as South Africa are our own worst enemy and pain experienced economically recently has mostly been self inflicted, including higher prices paid for crude oil imports. Better fiscal policy and management of government finances and the economy would have seen a more stable exchange rate and far more stable economic environment for South African's and South African firms to operate in.