South African Market Insights
  • Home
  • Blog
    • Blog-5Jun2018
    • Blog-18May2018
    • Blog-16May2018
    • Blog-3May2018
    • Blog-2May2018
    • Blog-30Apr2018
    • Blog-26Apr2018
    • Blog-24Apr2018
    • Blog-18Apr2018
    • Blog-17Apr2018
    • Blog-16Apr2018
    • Blog-3Apr2018
    • Blog-22Mar2018
    • Blog-20Mar2018
    • Blog-19Mar2018
    • Blog-23Oct2017
    • Blog-20Oct2017
    • Blog-11Oct2017
    • Blog-10Oct2017
    • Blog-6Oct2017
    • Blog-3Oct2017
    • Blog-2Oct2017
  • Economics
    • Rand Dollar Exchange Rate
    • South Africa's GDP
    • South Africa's Unemployment
    • SA by numbers
    • Economic Progress Index
    • Taylors Rule
    • South Africa's Formal Business Sector
    • South-Africa's-Fiscal-Policy
    • SA EU Trade Data
    • Inflation Heat Map
    • Population Density Map
    • Labour Market Dynamics
    • Estimating the Size of the Informal Economy
    • SA Consumer Spending Patterns
    • South Africa's Monetary Fiscal Policy Mix
    • GDP Animations >
      • SouthAfrica
      • WesternCape
      • EasternCape
      • NorthernCape
      • FreeState
      • KwaZuluNatal
      • NorthWest
      • Gauteng
      • Mpumalanga
      • Limpopo
    • South Africa's Economic Structure
    • South Africa's Economic History
    • South Africa's Trade Data Page
    • South Africa's Food and Beverages Sector
    • Financial Well-being of South African Companies_2015
    • SA vs the World
    • Budget Day Page (24 Feb 2016)
  • Stock in Focus
    • JSE ALSI Chart
    • Sector Comparison Page
    • JSE-Calendar-Tracker-2019
    • Adcorp (ADR)
    • Amazon (AMZN)
    • Apple (AAPL)
    • Ascendis (ASC)
    • AVI (AVI)
    • Bidvest (BVT)
    • Blue Label Telecoms (BLU)
    • Bowler Metcalf (BCF)
    • Capitec (CPI)
    • City Lodge Hotel Group
    • Clicks Group (CLS)
    • Coronation (CML)
    • Curro Holdings (COH)
    • Discovery (DSY)
    • Distell (DST)
    • EOH (EOH)
    • Famous Brands (FBR)
    • Ferrari (RACE)
    • FirstRand Group (FSR)
    • Grindrod (GND)
    • GrowthPoint (GRT)
    • Holdsport (HSP)
    • Harley-Davidson (HOG)
    • Hyprop (HYP)
    • Hyprop (HYP)_1Jun2016
    • Investec Property Fund (IPF)
    • JSE (JSE)
    • Massmart (MSM)
    • MediClinic (MEI)
    • MTN (MTN)
    • MTN (MTN)_May2016
    • Mr Price Group (MRP)
    • Mr Price Group (MRP)_8APR2016
    • Nedbank (NED)
    • OneLogix (OLG)
    • Peregrine Holdings (PGR)
    • Pick 'n Pay Stores (PIK)
    • Pioneer Foods (PFG)
    • PSG Group (PSG)
    • Quantum Foods (QFH)
    • RCL Foods (RCL)
    • Remgro (REM)
    • Richemont (CFR)
    • RMB Holdings (RMH)
    • Rolfes (RLF)
    • Sanlam (SLM)
    • Sasol (SOL)
    • Sasol (SOL)_18sep2016
    • Santova (SNV)
    • Spar Group (SPP)
    • Shoprite Holdings (SHP)
    • Spur Corporation (SUR)_7Sep2017
    • Standard Bank (SBK)
    • Steinhoff International Holdings (SNH)
    • Stor-Age (SSS)
    • Super Group (SPG)
    • Taste Holdings (TAS)_30May2016
    • The Foshini Group (TFG)
    • Value Logistics (VLE)
    • Vodacom (VOD)
    • Wilson Bayly Holmes Ovcon (WBO)
    • Woolworths (WHL)
    • Woolworths (WHL)_24Aug2017
    • Zeder (ZED)
  • Online Calculators
    • Rand Petrol Price Estimator
    • Share Valuation
    • Financial Ratios Calculator
    • GDP Growth Estimator
    • Future Value of Investment Calculator
    • Loan repayment calculator
  • Contact
  • About
  • Search

< South Africa's GDP
Economics Main Page >

Detailed coverage of second business impact survey of the COVID-19 pandemic in South Africa​

Category: Covid-19 and formal business sector
Date: 17 May 2020

Related Topics

We take a detailed look at the second wave business impact survey conducted by Statistics South Africa that is used to assess the impact of Covid-19 pandemic on businesses operating in South Africa.  This particular survey period is from 14 April 2020 to 30 April 2020
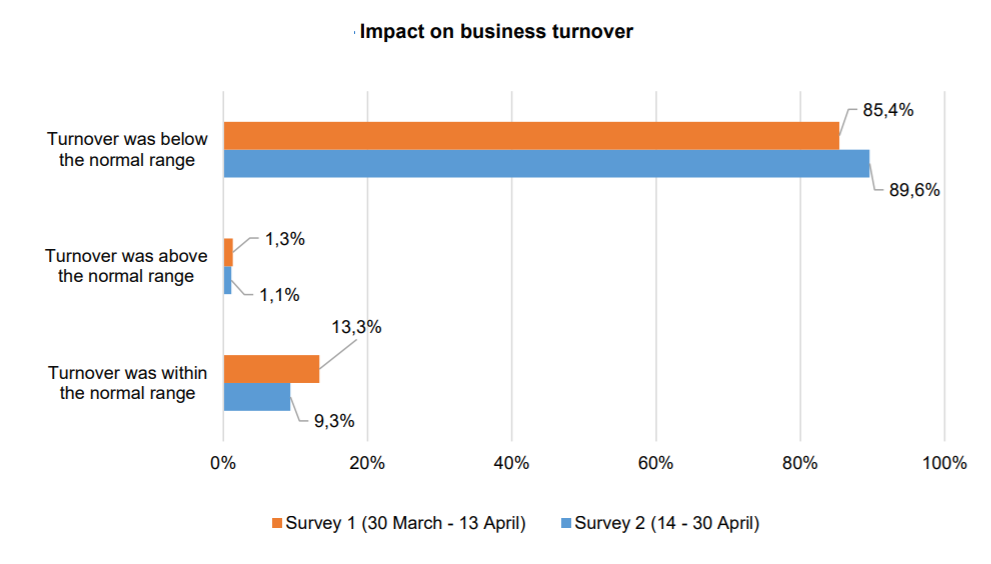
"​The majority of responding businesses (89,6%) reported that business turnover was below the normal range."
Business Impact survey of Covid-19 in South Africa
  • Behavioral impact of Covid-19

Background

In response to the COVID-19 pandemic that has caused such widespread disruption to economies and societies across the globe, Statistics South Africa has conducted two surveys on the impact of the pandemic on South African business. The first survey covered the period 30 March to 13 April 2020, and the results were published on 21 April. This publication provides the results of the second survey, covering the period 14 to 30 April 2020. The second survey contains additional variables or questions that provide further insight into the impact of the COVID-19 pandemic, and the survey scope was also expanded by including the agriculture and hunting sectors. The findings contained in the first and second business impact surveys cover South Africa’s level 5 lockdown period.

Survey information
  • Survey status: Experimental statistics aimed at providing an early indicator of the business impact resulting from COVID-19
  • Selection criteria: Selected businesses operating within various industries in South Africa that are registered for value added tax (VAT); the following are excluded: financial intermediation, insurance, pension funding, government, education, and business services ‘not elsewhere classified’
  • Number of responding businesses: 2 182
  • Reference period: 14 April 2020 – 30 April 2020 
Key results
  • The majority of responding businesses (89,6%) reported that business turnover was below the normal range.
  • 47,9% indicated temporary closure or paused trading activity.
  • 508 of responding businesses with annual turnover less than R2 million indicated that they have temporarily closed or paused trading.
  • 8,6% have permanently ceased trading.
  • 36,4% reported the laying off of staff in the short term.
  • 45,6% expected their workforce size to decrease in the two weeks following the reference period.
  • 32,9% indicated that prices of materials, goods or services purchased increased more than normal.
  • Access to financial resources: 38,3% indicated a decrease while 37,7% indicated access to financial resources remained the same.
  • 30,0% of businesses responding to the survey indicated that they have applied for financial assistance using government relief schemes.
  • 29,7% indicated they can survive less than a month without any turnover, while 55,3% can survive between 1 and 3 months.
  • 50,4% of the workforce were unable to meet business demands, and 35,7% of the workforce were able to meet business demands (the rest reported ‘not sure’).
  •  A majority of respondents (56,3%) indicated that their businesses would be operating during the level 4 lockdown period

Financial Performance

Turnover relates to the income generated by a business when conducting its core operations within a specified timeframe, and forms a key measure of business performance. Turnover includes sales of goods, services rendered, leasing and hiring of capital assets, and rental/leasing of land, buildings and other structures (see Stats SA’s Annual Financial Statistics survey). The second survey (14–30 April 2020) showed that 89,6% of responding businesses had turnover that was lower than their normal range, up from 85,4% in the first survey (30 March – 13 April); 1,1% reported that turnover was higher than their normal range; and 9,3% reported that turnover was within their normal range 
Picture
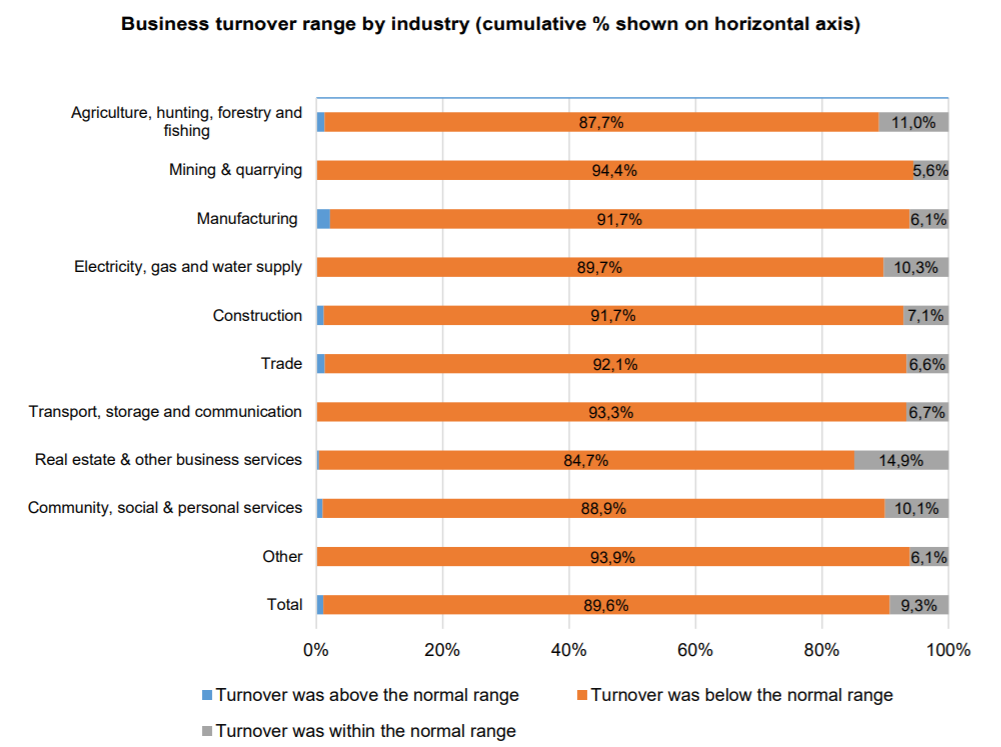
The image below shows a widespread adverse impact of the COVID-19 pandemic on business turnover across all industries. The industries reporting the highest proportions within the normal range were agriculture, hunting, forestry and fishing; electricity, gas and water; and real estate and other business services. A limited number of respondents indicated that their turnover was above the normal range: these were in agriculture, hunting, forestry and fishing; manufacturing; construction; trade; and community, social and personal services. 
Picture
The image below provides a comparison of trading status between the first and second business impact surveys. In the first survey 12,3% of businesses continued to trade at full capacity, and this dropped to 8,8% in the second survey. The proportion of businesses that have temporarily closed or paused trading increased from 46,4% in the first survey to 47,9% in the second survey
Picture
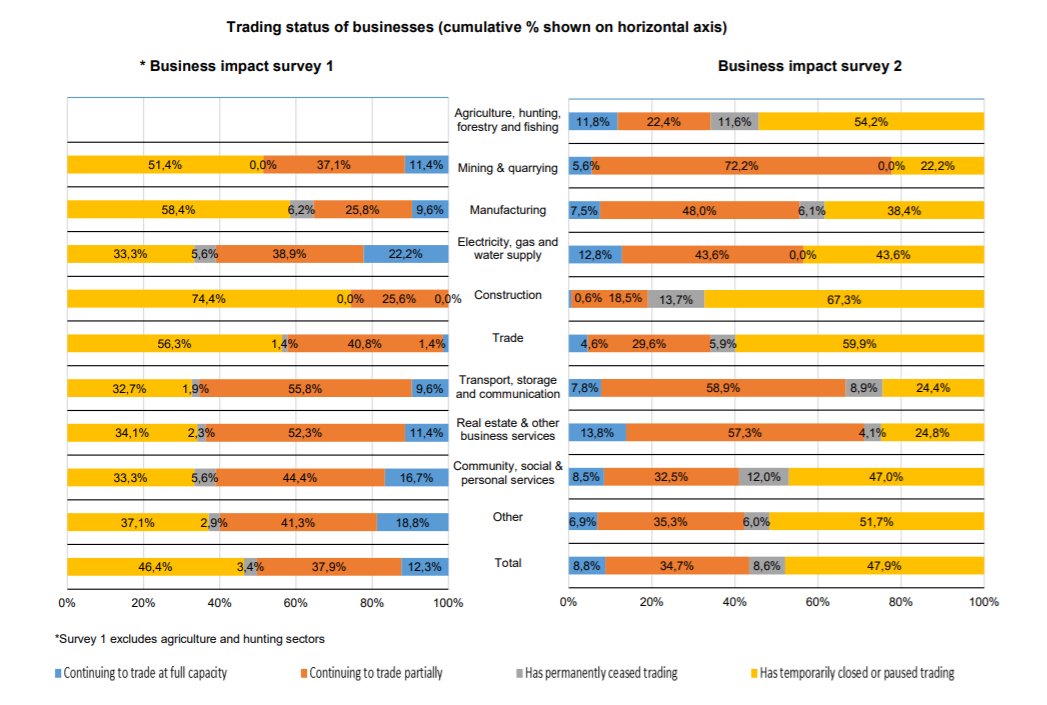
South African Market Insights commentary on the graphic above. The worrying part for us is the grey blocks in the graphic to the right.  While the sample size of firms is very small its still significant enough to make inferences about the overall impact of the Covid-19 pandemic and its impact on the economy. Based on the second wave of the business impact survey 13.7% of construction firms said they have permanently stopped trading, 12% of social and personal services firms said they have permanently stopped trading and 11.6% of agriculture,hunting, forestry and fishing firms stated they they are closing their doors. Anyways we had to raise this in our article. Lets get back to the write up and data from Stats SA

Workforce implications

​Businesses were requested to indicate what measures were taken to cope with the impact of COVID-19 on their workforce, illustrated in the image below.. More than half of respondents indicated either decreased working hours (24,9%) or laying off of staff in the short term (36,4%); 16,3% reported ‘other’ measures taken; 19,8% reported no measures taken; 1,9% reported increased working hours; and 0,7% will be recruiting staff in the short term.
Picture

Newsletter Subscription:

    Please enter your email address below to subscribe to our newsletter. It will be ad hoc newsletters and we wont bombard your email inbox with emails. We will NEVER supply your contact details to any third party.

Subscribe to Newsletter

Additional content

Related Topics

  • ​Behavioral impact of Covid-19


​Homepage

Economics Page
Stock in Focus Page


​About


Contact Us

Copyright © 2015
  • Home
  • Blog
    • Blog-5Jun2018
    • Blog-18May2018
    • Blog-16May2018
    • Blog-3May2018
    • Blog-2May2018
    • Blog-30Apr2018
    • Blog-26Apr2018
    • Blog-24Apr2018
    • Blog-18Apr2018
    • Blog-17Apr2018
    • Blog-16Apr2018
    • Blog-3Apr2018
    • Blog-22Mar2018
    • Blog-20Mar2018
    • Blog-19Mar2018
    • Blog-23Oct2017
    • Blog-20Oct2017
    • Blog-11Oct2017
    • Blog-10Oct2017
    • Blog-6Oct2017
    • Blog-3Oct2017
    • Blog-2Oct2017
  • Economics
    • Rand Dollar Exchange Rate
    • South Africa's GDP
    • South Africa's Unemployment
    • SA by numbers
    • Economic Progress Index
    • Taylors Rule
    • South Africa's Formal Business Sector
    • South-Africa's-Fiscal-Policy
    • SA EU Trade Data
    • Inflation Heat Map
    • Population Density Map
    • Labour Market Dynamics
    • Estimating the Size of the Informal Economy
    • SA Consumer Spending Patterns
    • South Africa's Monetary Fiscal Policy Mix
    • GDP Animations >
      • SouthAfrica
      • WesternCape
      • EasternCape
      • NorthernCape
      • FreeState
      • KwaZuluNatal
      • NorthWest
      • Gauteng
      • Mpumalanga
      • Limpopo
    • South Africa's Economic Structure
    • South Africa's Economic History
    • South Africa's Trade Data Page
    • South Africa's Food and Beverages Sector
    • Financial Well-being of South African Companies_2015
    • SA vs the World
    • Budget Day Page (24 Feb 2016)
  • Stock in Focus
    • JSE ALSI Chart
    • Sector Comparison Page
    • JSE-Calendar-Tracker-2019
    • Adcorp (ADR)
    • Amazon (AMZN)
    • Apple (AAPL)
    • Ascendis (ASC)
    • AVI (AVI)
    • Bidvest (BVT)
    • Blue Label Telecoms (BLU)
    • Bowler Metcalf (BCF)
    • Capitec (CPI)
    • City Lodge Hotel Group
    • Clicks Group (CLS)
    • Coronation (CML)
    • Curro Holdings (COH)
    • Discovery (DSY)
    • Distell (DST)
    • EOH (EOH)
    • Famous Brands (FBR)
    • Ferrari (RACE)
    • FirstRand Group (FSR)
    • Grindrod (GND)
    • GrowthPoint (GRT)
    • Holdsport (HSP)
    • Harley-Davidson (HOG)
    • Hyprop (HYP)
    • Hyprop (HYP)_1Jun2016
    • Investec Property Fund (IPF)
    • JSE (JSE)
    • Massmart (MSM)
    • MediClinic (MEI)
    • MTN (MTN)
    • MTN (MTN)_May2016
    • Mr Price Group (MRP)
    • Mr Price Group (MRP)_8APR2016
    • Nedbank (NED)
    • OneLogix (OLG)
    • Peregrine Holdings (PGR)
    • Pick 'n Pay Stores (PIK)
    • Pioneer Foods (PFG)
    • PSG Group (PSG)
    • Quantum Foods (QFH)
    • RCL Foods (RCL)
    • Remgro (REM)
    • Richemont (CFR)
    • RMB Holdings (RMH)
    • Rolfes (RLF)
    • Sanlam (SLM)
    • Sasol (SOL)
    • Sasol (SOL)_18sep2016
    • Santova (SNV)
    • Spar Group (SPP)
    • Shoprite Holdings (SHP)
    • Spur Corporation (SUR)_7Sep2017
    • Standard Bank (SBK)
    • Steinhoff International Holdings (SNH)
    • Stor-Age (SSS)
    • Super Group (SPG)
    • Taste Holdings (TAS)_30May2016
    • The Foshini Group (TFG)
    • Value Logistics (VLE)
    • Vodacom (VOD)
    • Wilson Bayly Holmes Ovcon (WBO)
    • Woolworths (WHL)
    • Woolworths (WHL)_24Aug2017
    • Zeder (ZED)
  • Online Calculators
    • Rand Petrol Price Estimator
    • Share Valuation
    • Financial Ratios Calculator
    • GDP Growth Estimator
    • Future Value of Investment Calculator
    • Loan repayment calculator
  • Contact
  • About
  • Search