South African Market Insights
  • Home
  • Blog
    • Blog-5Jun2018
    • Blog-18May2018
    • Blog-16May2018
    • Blog-3May2018
    • Blog-2May2018
    • Blog-30Apr2018
    • Blog-26Apr2018
    • Blog-24Apr2018
    • Blog-18Apr2018
    • Blog-17Apr2018
    • Blog-16Apr2018
    • Blog-3Apr2018
    • Blog-22Mar2018
    • Blog-20Mar2018
    • Blog-19Mar2018
    • Blog-23Oct2017
    • Blog-20Oct2017
    • Blog-11Oct2017
    • Blog-10Oct2017
    • Blog-6Oct2017
    • Blog-3Oct2017
    • Blog-2Oct2017
  • Economics
    • Rand Dollar Exchange Rate
    • South Africa's GDP
    • South Africa's Unemployment
    • SA by numbers
    • Economic Progress Index
    • Taylors Rule
    • South Africa's Formal Business Sector
    • South-Africa's-Fiscal-Policy
    • SA EU Trade Data
    • Inflation Heat Map
    • Population Density Map
    • Labour Market Dynamics
    • Estimating the Size of the Informal Economy
    • SA Consumer Spending Patterns
    • South Africa's Monetary Fiscal Policy Mix
    • GDP Animations >
      • SouthAfrica
      • WesternCape
      • EasternCape
      • NorthernCape
      • FreeState
      • KwaZuluNatal
      • NorthWest
      • Gauteng
      • Mpumalanga
      • Limpopo
    • South Africa's Economic Structure
    • South Africa's Economic History
    • South Africa's Trade Data Page
    • South Africa's Food and Beverages Sector
    • Financial Well-being of South African Companies_2015
    • SA vs the World
    • Budget Day Page (24 Feb 2016)
  • Stock in Focus
    • JSE ALSI Chart
    • Sector Comparison Page
    • JSE-Calendar-Tracker-2019
    • Adcorp (ADR)
    • Amazon (AMZN)
    • Apple (AAPL)
    • Ascendis (ASC)
    • AVI (AVI)
    • Bidvest (BVT)
    • Blue Label Telecoms (BLU)
    • Bowler Metcalf (BCF)
    • Capitec (CPI)
    • City Lodge Hotel Group
    • Clicks Group (CLS)
    • Coronation (CML)
    • Curro Holdings (COH)
    • Discovery (DSY)
    • Distell (DST)
    • EOH (EOH)
    • Famous Brands (FBR)
    • Ferrari (RACE)
    • FirstRand Group (FSR)
    • Grindrod (GND)
    • GrowthPoint (GRT)
    • Holdsport (HSP)
    • Harley-Davidson (HOG)
    • Hyprop (HYP)
    • Hyprop (HYP)_1Jun2016
    • Investec Property Fund (IPF)
    • JSE (JSE)
    • Massmart (MSM)
    • MediClinic (MEI)
    • MTN (MTN)
    • MTN (MTN)_May2016
    • Mr Price Group (MRP)
    • Mr Price Group (MRP)_8APR2016
    • Nedbank (NED)
    • OneLogix (OLG)
    • Peregrine Holdings (PGR)
    • Pick 'n Pay Stores (PIK)
    • Pioneer Foods (PFG)
    • PSG Group (PSG)
    • Quantum Foods (QFH)
    • RCL Foods (RCL)
    • Remgro (REM)
    • Richemont (CFR)
    • RMB Holdings (RMH)
    • Rolfes (RLF)
    • Sanlam (SLM)
    • Sasol (SOL)
    • Sasol (SOL)_18sep2016
    • Santova (SNV)
    • Spar Group (SPP)
    • Shoprite Holdings (SHP)
    • Spur Corporation (SUR)_7Sep2017
    • Standard Bank (SBK)
    • Steinhoff International Holdings (SNH)
    • Stor-Age (SSS)
    • Super Group (SPG)
    • Taste Holdings (TAS)_30May2016
    • The Foshini Group (TFG)
    • Value Logistics (VLE)
    • Vodacom (VOD)
    • Wilson Bayly Holmes Ovcon (WBO)
    • Woolworths (WHL)
    • Woolworths (WHL)_24Aug2017
    • Zeder (ZED)
  • Online Calculators
    • Rand Petrol Price Estimator
    • Share Valuation
    • Financial Ratios Calculator
    • GDP Growth Estimator
    • Future Value of Investment Calculator
    • Loan repayment calculator
  • Contact
  • About
  • Search

< Inflation Heat Map
Economics Main Page >

South African Reserve Bank (SARB) monetary policy review 31 October 2018

Category: Monetary policy and inflation​​​
Date: 31 October 2018

Related Topics

We take a look at a number of graphics and charts published by the South African Reserve Bank (SARB) in their monetary policy review document. It makes for interesting reading and points to SARB expecting higher interest rates in the next two years.
Picture
  • Inflation Heat Map
  • South Africa's GDP

So SARB predicting higher interest rates in the next two years?

We would be very cautious in believing any of the forecasts that comes from the South African Reserve Bank. Over the years they have been hopelessly out of form with predicting the inflation rate, as their regular MPC updated inflation forecasts show. Constant revisions up and down are made as the latest information becomes available. Usually their two year forecasts of where inflation is expected to be is far off from where it actually ends up being. So SARB's forecasting should be taken with a pinch of salt. But in saying that the image below shows the SARB's prediction of the REPO rate for the next couple of years. The REPO rate is the rate at which banks borrow from the Reserve Bank. They then add another 350 basis points to the REPO rate and call this the "Prime" lending rate. Prime lending rate is given to those consumers with outstanding credit scores and can easily finance requested debt.
Picture
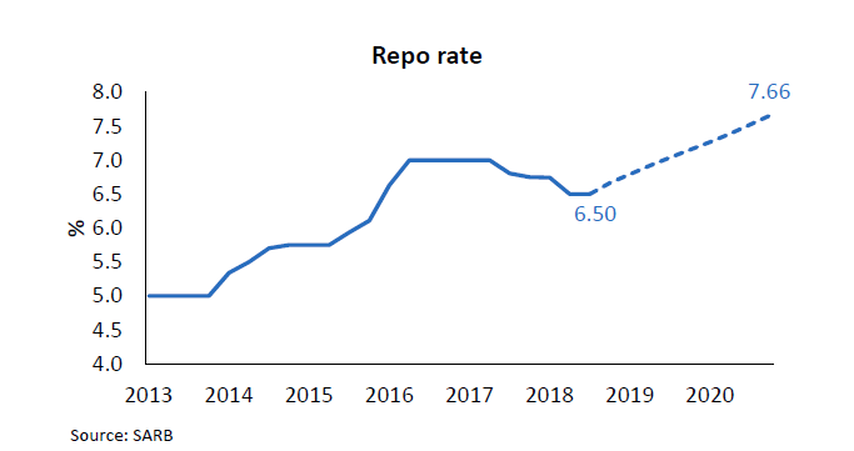
South African Reserve Bank (SARB) REPO rate forecast past 2020
The current REPO rate is sitting at 6.5%, with SARB predicting it will average 7.66% by the end of 2021 it looks like. That is a 17.9% increase in the REPO rate over the next two to three years. South Africans should be very worried about this, as the cost of their outstanding debt is likely to go up by a very similar percentage. So assuming a home loan of R1 000 000, was granted at Prime of 10.5% and paid off over 240 months, the consumer would pay about R9 650 a month on the bond. Should the SARB raise the REPO rate and it settles at 7.66% as predicted by SARB, that same mortgage bond will now cost R10 430 a month. An increase of R780 a month. Now add a few cars, or a investment property into the mix, or a more expensive property into the equation and its clear to see that South Africans will come under immense financial pressure should interest rates reach the levels predicted by the South African Reserve Bank. So why is SARB predicting higher interest rates. Well it stems from the fact that they expect inflation to be at higher levels than what they want it to be. SARB's target rate for inflation is between 3% and 6%. So lets say their ideal inflation rate is 4.5%.

The image below shows SARB forecast for headline inflation (the official inflation rate of South Africa) as well as a "Core" inflation rate. This is an inflation rate in which volatile items such as fuel and electricity prices are excluded from the inflation numbers to give a better picture of the underlying nature of inflation.
Picture
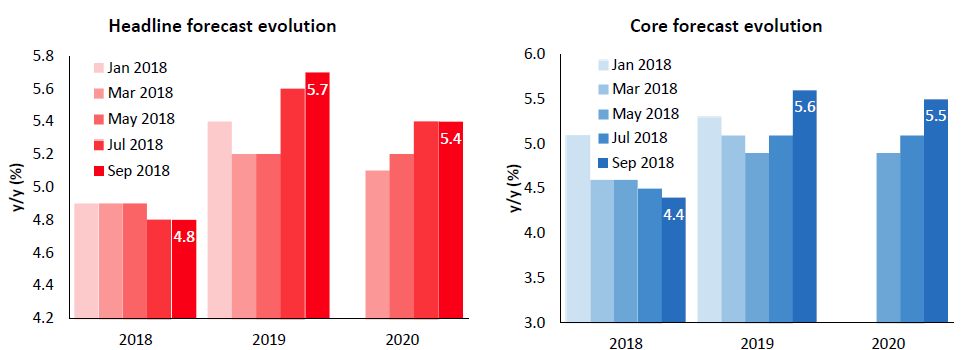
South African Reserve Bank Headline and Core inflation forecasts up to 2020
So the predicted headline inflation rate for 2018 is sitting at 4.8% for 2018, rising in 2019 to 5.7% and then declining a bit again in 2020 to 5.4%. While these rates are well within the 3% to 6% inflation target of the bank, it is a way off from the "mid point" level of 4.5%, which we believe is the bank's ideal inflation rate. So why the increase in the forecasted inflation for 2019 and 2020? The SARB believes that the weakening exchange rate will add inflationary pressures to local inflation as imported goods become more expensive, pushing up the prices of goods sold locally. The graphic below shows what SARB believes to be the exchange rate gap and its potential impact in 2019 before tapering off towards 2020.
Picture
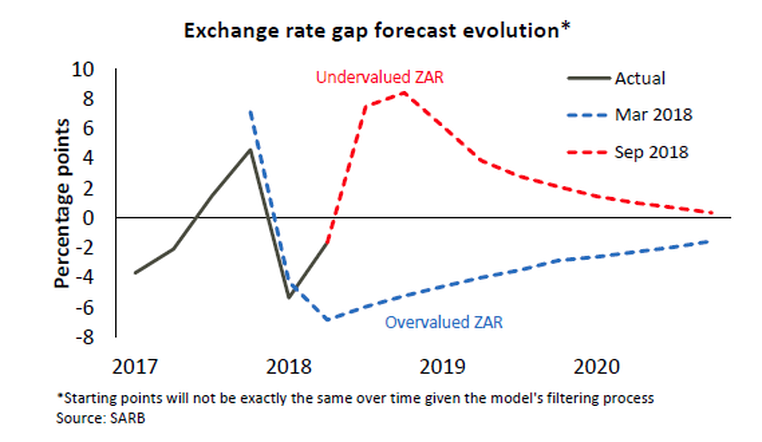
Exchange Rate Gap as estimated by the South African Reserve Bank (SARB)
While there might be some merit to the exchange rate weakening leading to higher import prices and thus higher local inflation, we believe the higher world oil prices combined with a weaker exchange rate is the biggest cause for concern regarding local inflation. As this lead to higher fuel prices, which leads to higher input costs for farmers, producers, manufacturers, transporters, and eventually prices consumers pay for goods that were produced, manufactured and transported to retail outlets. The image below shows the evolution of South African fuel prices over the last couple of years, and just how much SARB's forecast of domestic fuel prices changed from March 2018 to September 2018, due to strong oil prices and the weak exchange rate.
Picture
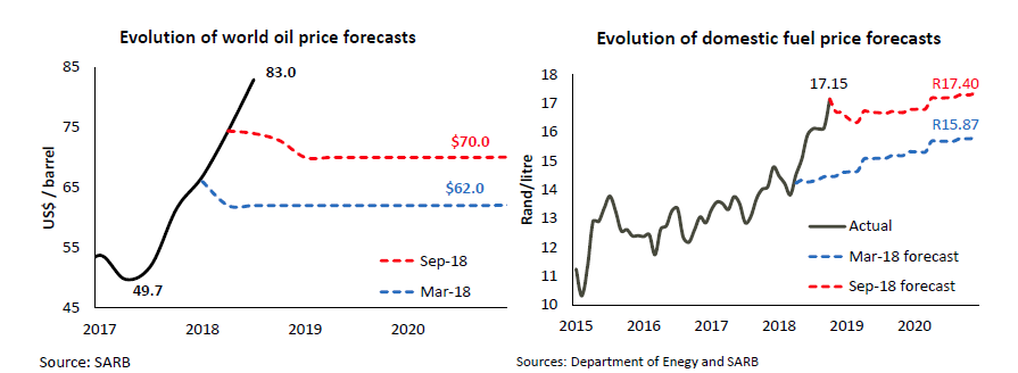
South African Reserve Bank (SARB) forecast of world oil prices and South African fuel prices
What is interesting to note about the image above is the fact that the SARB is predicting an average oil price of $70 a barrel over the next 3 years. So imagine of oil prices blow out above $100 again, SARB's inflation expectations will shoot through the roof and interest rates would end up a lot higher than the 7.66% predicted  as shown in one of the earlier images. Our advice for South Africans would therefore be to be very careful in taking on any new debt, especially to finance nice to haves such as cars. Rather stick to taking on debt to buy assets such as houses. And lastly we show an image from the SARB in which they show that over the last couple of months there has been a clear change in the stance of the South African Reserve Bank from a more accommodative monetary policy to a more contractionary policy
Picture
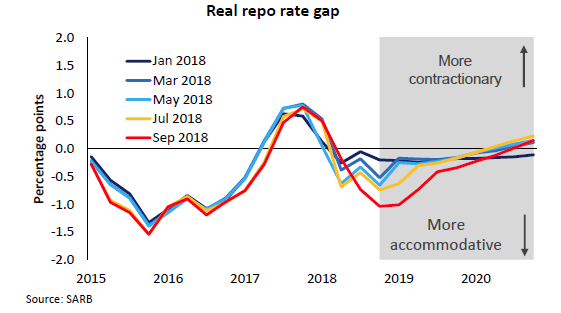
The above is the opposite of what South Africa's economy needs right now. Just showing once again that South Africa's monetary fiscal policy mix is working against one another and limits the potential growth South Africa's economy can and must reach (at this point to reduce massive levels of unemployment. South Africans will be under severe pressure over the next couple of years, and with consumers making up a large part of South Africa's economic growth over the last couple of years, we have little hope of consumers driving economic growth over the next couple of years, as higher fuel prices, higher inflation and higher interest rates starts to take hold of ordinary South Africans wallet. Our advice, reduce debt, reduce unneccesary spending and start saving more to get through the tough times ahead.

Newsletter Subscription:

    Please enter your email address below to subscribe to our newsletter. It will be ad hoc newsletters and we wont bombard your email inbox with emails. We will NEVER supply your contact details to any third party.

Subscribe to Newsletter

Additional content

Related Topics

  • ​Inflation Heat Map
  • South Africa's GDP


​Homepage

Economics Page
Stock in Focus Page


​About


Contact Us

Copyright © 2015
  • Home
  • Blog
    • Blog-5Jun2018
    • Blog-18May2018
    • Blog-16May2018
    • Blog-3May2018
    • Blog-2May2018
    • Blog-30Apr2018
    • Blog-26Apr2018
    • Blog-24Apr2018
    • Blog-18Apr2018
    • Blog-17Apr2018
    • Blog-16Apr2018
    • Blog-3Apr2018
    • Blog-22Mar2018
    • Blog-20Mar2018
    • Blog-19Mar2018
    • Blog-23Oct2017
    • Blog-20Oct2017
    • Blog-11Oct2017
    • Blog-10Oct2017
    • Blog-6Oct2017
    • Blog-3Oct2017
    • Blog-2Oct2017
  • Economics
    • Rand Dollar Exchange Rate
    • South Africa's GDP
    • South Africa's Unemployment
    • SA by numbers
    • Economic Progress Index
    • Taylors Rule
    • South Africa's Formal Business Sector
    • South-Africa's-Fiscal-Policy
    • SA EU Trade Data
    • Inflation Heat Map
    • Population Density Map
    • Labour Market Dynamics
    • Estimating the Size of the Informal Economy
    • SA Consumer Spending Patterns
    • South Africa's Monetary Fiscal Policy Mix
    • GDP Animations >
      • SouthAfrica
      • WesternCape
      • EasternCape
      • NorthernCape
      • FreeState
      • KwaZuluNatal
      • NorthWest
      • Gauteng
      • Mpumalanga
      • Limpopo
    • South Africa's Economic Structure
    • South Africa's Economic History
    • South Africa's Trade Data Page
    • South Africa's Food and Beverages Sector
    • Financial Well-being of South African Companies_2015
    • SA vs the World
    • Budget Day Page (24 Feb 2016)
  • Stock in Focus
    • JSE ALSI Chart
    • Sector Comparison Page
    • JSE-Calendar-Tracker-2019
    • Adcorp (ADR)
    • Amazon (AMZN)
    • Apple (AAPL)
    • Ascendis (ASC)
    • AVI (AVI)
    • Bidvest (BVT)
    • Blue Label Telecoms (BLU)
    • Bowler Metcalf (BCF)
    • Capitec (CPI)
    • City Lodge Hotel Group
    • Clicks Group (CLS)
    • Coronation (CML)
    • Curro Holdings (COH)
    • Discovery (DSY)
    • Distell (DST)
    • EOH (EOH)
    • Famous Brands (FBR)
    • Ferrari (RACE)
    • FirstRand Group (FSR)
    • Grindrod (GND)
    • GrowthPoint (GRT)
    • Holdsport (HSP)
    • Harley-Davidson (HOG)
    • Hyprop (HYP)
    • Hyprop (HYP)_1Jun2016
    • Investec Property Fund (IPF)
    • JSE (JSE)
    • Massmart (MSM)
    • MediClinic (MEI)
    • MTN (MTN)
    • MTN (MTN)_May2016
    • Mr Price Group (MRP)
    • Mr Price Group (MRP)_8APR2016
    • Nedbank (NED)
    • OneLogix (OLG)
    • Peregrine Holdings (PGR)
    • Pick 'n Pay Stores (PIK)
    • Pioneer Foods (PFG)
    • PSG Group (PSG)
    • Quantum Foods (QFH)
    • RCL Foods (RCL)
    • Remgro (REM)
    • Richemont (CFR)
    • RMB Holdings (RMH)
    • Rolfes (RLF)
    • Sanlam (SLM)
    • Sasol (SOL)
    • Sasol (SOL)_18sep2016
    • Santova (SNV)
    • Spar Group (SPP)
    • Shoprite Holdings (SHP)
    • Spur Corporation (SUR)_7Sep2017
    • Standard Bank (SBK)
    • Steinhoff International Holdings (SNH)
    • Stor-Age (SSS)
    • Super Group (SPG)
    • Taste Holdings (TAS)_30May2016
    • The Foshini Group (TFG)
    • Value Logistics (VLE)
    • Vodacom (VOD)
    • Wilson Bayly Holmes Ovcon (WBO)
    • Woolworths (WHL)
    • Woolworths (WHL)_24Aug2017
    • Zeder (ZED)
  • Online Calculators
    • Rand Petrol Price Estimator
    • Share Valuation
    • Financial Ratios Calculator
    • GDP Growth Estimator
    • Future Value of Investment Calculator
    • Loan repayment calculator
  • Contact
  • About
  • Search