|
Related Topics |
|
Ever wondered how much money South Africans are taking out of South Africa? Or wondered how much money foreigners are investing in South Africa? We compare foreign investments in South Africa (into shares and bonds etc) to South Africans investing offshore.
With loads of financial advisers and asset managers suggesting South Africans should invest more of their savings offshore is this message starting to hit home and are South Africans actually investing money offshore? |
|
Foreign-owned assets in South Africa
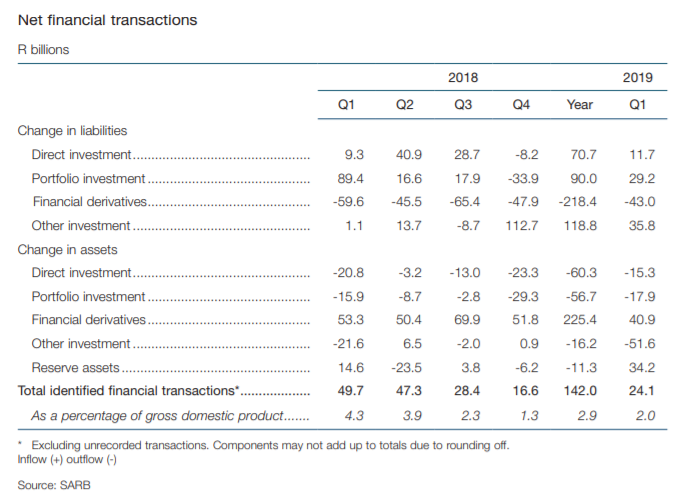
The South African Reserve Bank said the following regarding foreign owned assets in South Africa
South Africa’s direct investment liabilities reverted from an outflow of R8.2 billion in the fourth quarter of 2018 to an inflow of R11.7 billion in the first quarter of 2019, as domestic private sector companies received equity and debt funding from foreign parent companies. Portfolio investment liabilities also reverted from an outflow of R33.9 billion in the fourth quarter of 2018 to an inflow of R29.2 billion in the first quarter of 2019, as non-residents’ acquisition of domestic debt securities exceeded net sales of domestic equities. Net purchases of debt securities of R35.9 billion in the first quarter of 2019 reflected a reversal from net sales of R18.2 billion in the previous quarter.
Net sales of domestic equities of R6.8 billion in the first quarter of 2019 brought cumulative net sales for the past three quarters to R29.9 billion. Other investment liabilities recorded a further inflow of only R35.8 billion in the first quarter of 2019 following an inflow of R113 billion in the fourth quarter of 2018. The inflow in the first quarter of 2019 comprised mostly short-term loans to the domestic private non-banking sector, which was partly offset by non-residents’ withdrawal of deposits from domestic banks.
South African-owned assets abroad
Looking at South African-owned assets abroad SARB had the following to say in their latest quarterly bulletin.
South Africa’s direct foreign investment assets increased by R15.3 billion in the first quarter of 2019 following acquisitions of R23.3 billion in the fourth quarter of 2018. The outflow in the first quarter of 2019 could be attributed to an increase in South African private non-banking companies’ equity holdings in foreign subsidiaries and associates as well as the extension of loans to these companies. South African residents’ acquisition of foreign portfolio assets of R17.9 billion in the first quarter of 2019 was less than the R29.3 billion recorded in the fourth quarter of 2018. In the first quarter of 2019, the domestic private non-banking sector acquired foreign equity and debt securities, while the domestic banking sector acquired foreign debt securities. Other investment assets reverted from a small inflow of R0.9 billion in the fourth quarter of 2018 to an outflow of R51.6 billion in the first quarter of 2019, as the domestic banking sectors’ loans to non-residents under repurchase agreements increased and the private non-banking sector extended short-term loans to non-residents
South Africa’s direct foreign investment assets increased by R15.3 billion in the first quarter of 2019 following acquisitions of R23.3 billion in the fourth quarter of 2018. The outflow in the first quarter of 2019 could be attributed to an increase in South African private non-banking companies’ equity holdings in foreign subsidiaries and associates as well as the extension of loans to these companies. South African residents’ acquisition of foreign portfolio assets of R17.9 billion in the first quarter of 2019 was less than the R29.3 billion recorded in the fourth quarter of 2018. In the first quarter of 2019, the domestic private non-banking sector acquired foreign equity and debt securities, while the domestic banking sector acquired foreign debt securities. Other investment assets reverted from a small inflow of R0.9 billion in the fourth quarter of 2018 to an outflow of R51.6 billion in the first quarter of 2019, as the domestic banking sectors’ loans to non-residents under repurchase agreements increased and the private non-banking sector extended short-term loans to non-residents
Total financial account numbers
The graphic below shows the net results of foreigners buying South African assets minus South Africans investing in foreign assets. Basically it shows if more money is leaving the country to buy foreign assets or if more money is coming into South Africa to buy local assets.
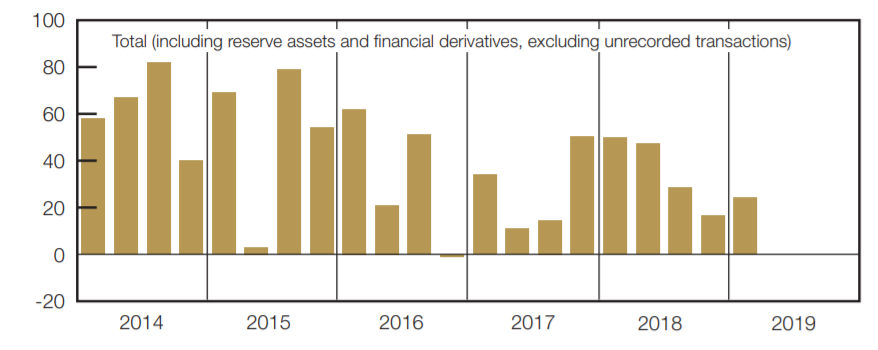
As the graphic above shows more money is coming into South Africa to buy domestic assets than money leaving the country to buy foreign assets. But over time the gap between the value of funds coming into SA compared to what is leaving SA is declining and 2018 and 2019 net inflow numbers are a lot lower than what was recorded in 2014 and 2015 for example. It either shows foreigners are starting to see less value in SA assets, or South Africans are starting to see greater value in foreign assets (or sees less value in SA assets and would rather take money offshore)