South African Market Insights
  • Home
  • Blog
    • Blog-5Jun2018
    • Blog-18May2018
    • Blog-16May2018
    • Blog-3May2018
    • Blog-2May2018
    • Blog-30Apr2018
    • Blog-26Apr2018
    • Blog-24Apr2018
    • Blog-18Apr2018
    • Blog-17Apr2018
    • Blog-16Apr2018
    • Blog-3Apr2018
    • Blog-22Mar2018
    • Blog-20Mar2018
    • Blog-19Mar2018
    • Blog-23Oct2017
    • Blog-20Oct2017
    • Blog-11Oct2017
    • Blog-10Oct2017
    • Blog-6Oct2017
    • Blog-3Oct2017
    • Blog-2Oct2017
  • Economics
    • Rand Dollar Exchange Rate
    • South Africa's GDP
    • South Africa's Unemployment
    • SA by numbers
    • Economic Progress Index
    • Taylors Rule
    • South Africa's Formal Business Sector
    • South-Africa's-Fiscal-Policy
    • SA EU Trade Data
    • Inflation Heat Map
    • Population Density Map
    • Labour Market Dynamics
    • Estimating the Size of the Informal Economy
    • SA Consumer Spending Patterns
    • South Africa's Monetary Fiscal Policy Mix
    • GDP Animations >
      • SouthAfrica
      • WesternCape
      • EasternCape
      • NorthernCape
      • FreeState
      • KwaZuluNatal
      • NorthWest
      • Gauteng
      • Mpumalanga
      • Limpopo
    • South Africa's Economic Structure
    • South Africa's Economic History
    • South Africa's Trade Data Page
    • South Africa's Food and Beverages Sector
    • Financial Well-being of South African Companies_2015
    • SA vs the World
    • Budget Day Page (24 Feb 2016)
  • Stock in Focus
    • JSE ALSI Chart
    • Sector Comparison Page
    • JSE-Calendar-Tracker-2019
    • Adcorp (ADR)
    • Amazon (AMZN)
    • Apple (AAPL)
    • Ascendis (ASC)
    • AVI (AVI)
    • Bidvest (BVT)
    • Blue Label Telecoms (BLU)
    • Bowler Metcalf (BCF)
    • Capitec (CPI)
    • City Lodge Hotel Group
    • Clicks Group (CLS)
    • Coronation (CML)
    • Curro Holdings (COH)
    • Discovery (DSY)
    • Distell (DST)
    • EOH (EOH)
    • Famous Brands (FBR)
    • Ferrari (RACE)
    • FirstRand Group (FSR)
    • Grindrod (GND)
    • GrowthPoint (GRT)
    • Holdsport (HSP)
    • Harley-Davidson (HOG)
    • Hyprop (HYP)
    • Hyprop (HYP)_1Jun2016
    • Investec Property Fund (IPF)
    • JSE (JSE)
    • Massmart (MSM)
    • MediClinic (MEI)
    • MTN (MTN)
    • MTN (MTN)_May2016
    • Mr Price Group (MRP)
    • Mr Price Group (MRP)_8APR2016
    • Nedbank (NED)
    • OneLogix (OLG)
    • Peregrine Holdings (PGR)
    • Pick 'n Pay Stores (PIK)
    • Pioneer Foods (PFG)
    • PSG Group (PSG)
    • Quantum Foods (QFH)
    • RCL Foods (RCL)
    • Remgro (REM)
    • Richemont (CFR)
    • RMB Holdings (RMH)
    • Rolfes (RLF)
    • Sanlam (SLM)
    • Sasol (SOL)
    • Sasol (SOL)_18sep2016
    • Santova (SNV)
    • Spar Group (SPP)
    • Shoprite Holdings (SHP)
    • Spur Corporation (SUR)_7Sep2017
    • Standard Bank (SBK)
    • Steinhoff International Holdings (SNH)
    • Stor-Age (SSS)
    • Super Group (SPG)
    • Taste Holdings (TAS)_30May2016
    • The Foshini Group (TFG)
    • Value Logistics (VLE)
    • Vodacom (VOD)
    • Wilson Bayly Holmes Ovcon (WBO)
    • Woolworths (WHL)
    • Woolworths (WHL)_24Aug2017
    • Zeder (ZED)
  • Online Calculators
    • Rand Petrol Price Estimator
    • Share Valuation
    • Financial Ratios Calculator
    • GDP Growth Estimator
    • Future Value of Investment Calculator
    • Loan repayment calculator
  • Contact
  • About
  • Search

< What the Big Mac index says about the value of the rand
Economics Main Page >

South Africa's government net borrowing requirements
​​​
​Date: 29 July 2018
Category: Economics

Related Topics

We take a look at South Africa's government net borrowing requirements, and the story it tells about the state of South Africa's government finances is worrying. To say the least.

Government has a  ever expanding budget with items and services to pay for, yet the revenue collected by government via taxes such as personal , corporate taxes and VAT cannot  keep up with the growth in government's budget, pushing government finances into the red and what this means is that government has to borrow money in order to meet all its budget needs.

Not the greatest picture being painted for South Africa's fiscal policy. 
Picture
  • SA monetary fiscal policy mix

South Africa's net borrowing position

The line chart below shows the South African government net borrowing position for each year as recorded at the end of March of each year from 1991. 
chart created with amCharts | amCharts
From the graphic above it is clear that South Africa's government has started to borrow a lot more to cover their budget expenses in the last number of years. From 2009 (when the financial crisis hit) government has been depending ever more an borrowing to finance their expenditure plans. Demand for government services has increased and continues to increase at a pace faster than South Africa's economic growth and faster than government's tax revenue collected, leading to ever more debt being taken on by the SA government in order to pay their obligations. The problem with this is the fact that this is not sustainable in the long run, and money that is being spent on serving the interest on all these borrowings is money taken away from South Africans that require government services, be it health care, security, education, infrastructure etc.

Large sclae corruption and looting at government departments and state owned enterprises such as ESKOM, SAA, PRASA, TRANSNET, DENEL doesn't help either. As these entities are being stripped of funds in dodgy dealings and stealing, they require more money to stay afloat which means government has to keep stepping in to provide funding and security and surety on loans these entities take on. Putting even more pressure on state finances. 


Government has attempted to cut spending at government departments but not enough is being done to curb wasteful and fruitless expenditure such as excessive international and domestic travel by government employees, lavish parties and functions being held by departments etc. There seems to be a total lack of accountability when it comes to the misuse of state funds, and this ensures that government officials keeps spending and wasting money with impunity without worrying about any of the consequences as nothing happens to those found to be wasting money and to those involved in corrupt activities.

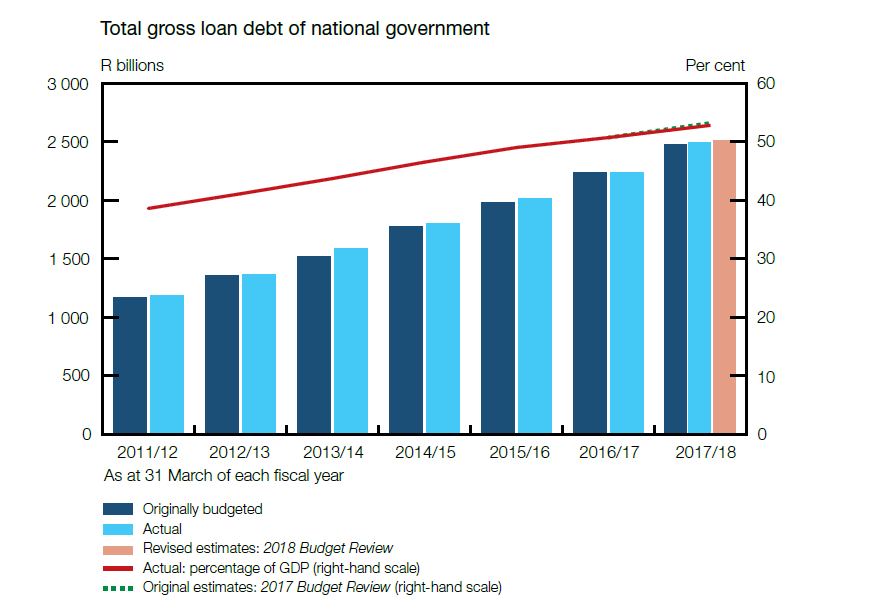
The image below shows the gross loans of national government as well as expressing it as a percentage of South Africa's GDP/economy

Picture
Currently gross loan debt of the South African government is roughly 53% of South Africa's GDP. Just showing the sheer size of the government debt problem, and at the current pace it doesn't look like it will be improving any time soon. In fact it looks like this percentage will be creeping even higher in the near future, especially considering the contraction in South Africa's economy in the first quarter of 2018 and not much growth expected in 2018, and a strong growing population as we discussed in this population article.

So South Africans should be very worried about the amount of debt the South African government is taking on, and the lack of drive to curb government spending and to reduce financial losses due to corruption and fruitless and wasteful expenditure.


Newsletter Subscription

    Please enter your email address below to subscribe to our newsletter. It will be ad hoc newsletters and we wont bombard your email inbox with emails. We will NEVER supply your contact details to any third party.

Subscribe to Newsletter

Additional content

Related Topics

  • ​SA monetary fiscal policy mix


​Homepage

Economics Page
Stock in Focus Page


​About


Contact Us

Copyright © 2015
  • Home
  • Blog
    • Blog-5Jun2018
    • Blog-18May2018
    • Blog-16May2018
    • Blog-3May2018
    • Blog-2May2018
    • Blog-30Apr2018
    • Blog-26Apr2018
    • Blog-24Apr2018
    • Blog-18Apr2018
    • Blog-17Apr2018
    • Blog-16Apr2018
    • Blog-3Apr2018
    • Blog-22Mar2018
    • Blog-20Mar2018
    • Blog-19Mar2018
    • Blog-23Oct2017
    • Blog-20Oct2017
    • Blog-11Oct2017
    • Blog-10Oct2017
    • Blog-6Oct2017
    • Blog-3Oct2017
    • Blog-2Oct2017
  • Economics
    • Rand Dollar Exchange Rate
    • South Africa's GDP
    • South Africa's Unemployment
    • SA by numbers
    • Economic Progress Index
    • Taylors Rule
    • South Africa's Formal Business Sector
    • South-Africa's-Fiscal-Policy
    • SA EU Trade Data
    • Inflation Heat Map
    • Population Density Map
    • Labour Market Dynamics
    • Estimating the Size of the Informal Economy
    • SA Consumer Spending Patterns
    • South Africa's Monetary Fiscal Policy Mix
    • GDP Animations >
      • SouthAfrica
      • WesternCape
      • EasternCape
      • NorthernCape
      • FreeState
      • KwaZuluNatal
      • NorthWest
      • Gauteng
      • Mpumalanga
      • Limpopo
    • South Africa's Economic Structure
    • South Africa's Economic History
    • South Africa's Trade Data Page
    • South Africa's Food and Beverages Sector
    • Financial Well-being of South African Companies_2015
    • SA vs the World
    • Budget Day Page (24 Feb 2016)
  • Stock in Focus
    • JSE ALSI Chart
    • Sector Comparison Page
    • JSE-Calendar-Tracker-2019
    • Adcorp (ADR)
    • Amazon (AMZN)
    • Apple (AAPL)
    • Ascendis (ASC)
    • AVI (AVI)
    • Bidvest (BVT)
    • Blue Label Telecoms (BLU)
    • Bowler Metcalf (BCF)
    • Capitec (CPI)
    • City Lodge Hotel Group
    • Clicks Group (CLS)
    • Coronation (CML)
    • Curro Holdings (COH)
    • Discovery (DSY)
    • Distell (DST)
    • EOH (EOH)
    • Famous Brands (FBR)
    • Ferrari (RACE)
    • FirstRand Group (FSR)
    • Grindrod (GND)
    • GrowthPoint (GRT)
    • Holdsport (HSP)
    • Harley-Davidson (HOG)
    • Hyprop (HYP)
    • Hyprop (HYP)_1Jun2016
    • Investec Property Fund (IPF)
    • JSE (JSE)
    • Massmart (MSM)
    • MediClinic (MEI)
    • MTN (MTN)
    • MTN (MTN)_May2016
    • Mr Price Group (MRP)
    • Mr Price Group (MRP)_8APR2016
    • Nedbank (NED)
    • OneLogix (OLG)
    • Peregrine Holdings (PGR)
    • Pick 'n Pay Stores (PIK)
    • Pioneer Foods (PFG)
    • PSG Group (PSG)
    • Quantum Foods (QFH)
    • RCL Foods (RCL)
    • Remgro (REM)
    • Richemont (CFR)
    • RMB Holdings (RMH)
    • Rolfes (RLF)
    • Sanlam (SLM)
    • Sasol (SOL)
    • Sasol (SOL)_18sep2016
    • Santova (SNV)
    • Spar Group (SPP)
    • Shoprite Holdings (SHP)
    • Spur Corporation (SUR)_7Sep2017
    • Standard Bank (SBK)
    • Steinhoff International Holdings (SNH)
    • Stor-Age (SSS)
    • Super Group (SPG)
    • Taste Holdings (TAS)_30May2016
    • The Foshini Group (TFG)
    • Value Logistics (VLE)
    • Vodacom (VOD)
    • Wilson Bayly Holmes Ovcon (WBO)
    • Woolworths (WHL)
    • Woolworths (WHL)_24Aug2017
    • Zeder (ZED)
  • Online Calculators
    • Rand Petrol Price Estimator
    • Share Valuation
    • Financial Ratios Calculator
    • GDP Growth Estimator
    • Future Value of Investment Calculator
    • Loan repayment calculator
  • Contact
  • About
  • Search