|
Related Topics |
|
With South Africa's 2019 budget speech done and dusted it is time to take a better look at the numbers the finance minister, Tito Mboweni spoke about.
In this article we will focus on South Africa's tax revenue sources, and what the government expects the various tax revenue sources to bring over the next couple of years. As we showed yesterday in our Fiscal Policy page, at the current rate the South African government will have to borrow around R1.1 billion per working day for the next 3 years, to fund their spending plans over the next three years. That just shows in how much trouble the government's finances are. |
|
So the SA government will have to take on a lot of debt?
First up, let us take a look at the National Treasury's expected government expenditure and expected government revenues over the next three years. The image as obtained from the National Treasury shows how much Treasury expects the government to collect in taxes and how much it plans on spending over the next couple of years.
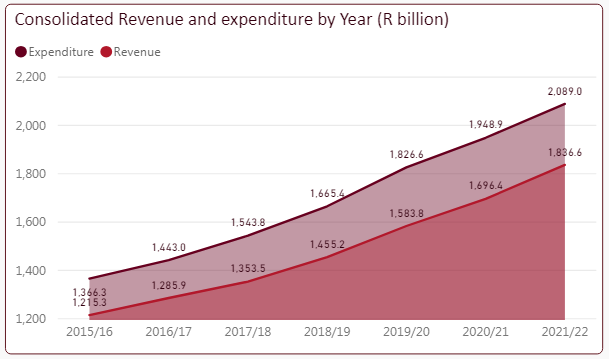
So lets break down the expected revenue and expenditure of the South African government as shown in the image above.
2019/2020
2020/2021
2021/2022
At R252 billion SA's government will borrow roughly R1.14 billion a day! Let that sink in. Imagine how many houses government could build for the poor with just the interest that will be paid on all these borrowings. See more regarding South Africa's Fiscal policy here.
2019/2020
- Revenue: R1.583 trillion
- Expenditure: R1.826 trillion
- Deficit: R243 billion
2020/2021
- Revenue: R1.696 trillion
- Expenditure: R1.949 trillion
- Deficit: R253 billion
2021/2022
- Revenue: R1.837 trillion
- Expenditure: R2.089 trillion
- Deficit: R252 billion
At R252 billion SA's government will borrow roughly R1.14 billion a day! Let that sink in. Imagine how many houses government could build for the poor with just the interest that will be paid on all these borrowings. See more regarding South Africa's Fiscal policy here.
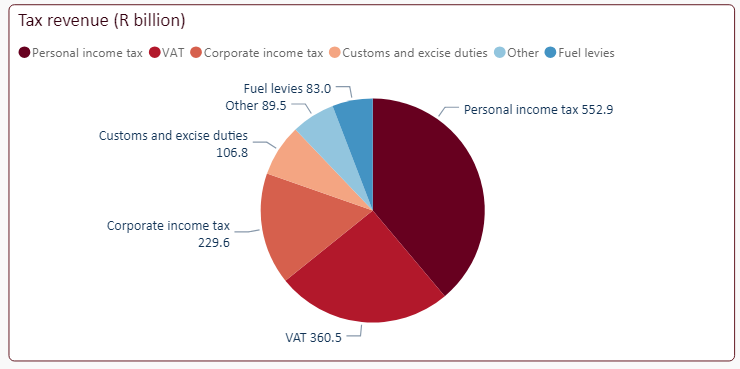
But lets forget about the shocking amount of money the government has to borrow to fund its expenditure plans for the next three years and lets focus our attention on the revenue (taxes) they expect to collect over the next couple of years. The pie chart below shows the expected tax revenue to be collected during 2019/2020 financial year.
2019/2020 financial year
|
2019/2020 financial year tax revenue contribution per tax type:
|
2020/2021 financial year

|
2020/2021 financial year tax revenue contribution per tax type:
|
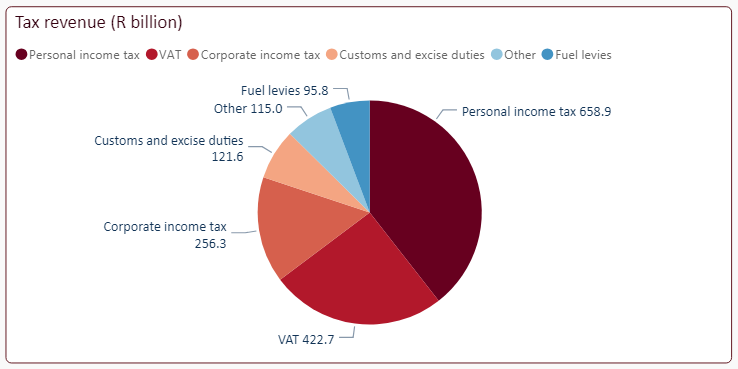
2021/2022 financial year
|
2021/2022 financial year tax revenue contribution per tax type:
|
So now that we know the expected revenue from the various tax types over the next couple of years, as suppled by the National Treasury, which tax category is expected to grow the fastest in terms of its contribution to overall tax revenues? The summary below shows the expected increases in tax revenues collected per tax type over the next three years (2019/2020 up to 2021/2022).
So from the above it is clear that government has earmarked "other" taxes to grow its contribution to state coffers. These include carbon emissions taxes, sugar taxes, taxes on estates, transfer duties and the likes.
Also worrying for South African citizens is the fact that the contribution of corporate income tax (company tax) is expected to shrink from the 2019/2020 expected 16.1% of total tax revenue to 15.3% in 2021/2022 while at the same time the contribution of personal income tax is expected to increase from 38.9% in 2019/2020 to 39.4% in 2021/2022
Just how far can tax payers be pushed before they leave the country or just refuse to pay taxes? It seems government is adamant to find out.
- Personal Income Tax: R106 billion (19.7% growth over the next three years)
- VAT: R62.2 billion (17.3% growth over the next three years)
- Corporate Income Tax: R26.7 billion (11.6% growth over the next three years)
- Customs and excise: R14.8 billion (13.9% growth over the next three years)
- Other: R25.5 billion (28.5% growth over the next three years)
- Fuel levies: R12.8 billion (15.4% growth over the next three years)
So from the above it is clear that government has earmarked "other" taxes to grow its contribution to state coffers. These include carbon emissions taxes, sugar taxes, taxes on estates, transfer duties and the likes.
Also worrying for South African citizens is the fact that the contribution of corporate income tax (company tax) is expected to shrink from the 2019/2020 expected 16.1% of total tax revenue to 15.3% in 2021/2022 while at the same time the contribution of personal income tax is expected to increase from 38.9% in 2019/2020 to 39.4% in 2021/2022
Just how far can tax payers be pushed before they leave the country or just refuse to pay taxes? It seems government is adamant to find out.