|
Kaap Agri (KAL) voluntary trading update for the six months ended March 2019
Date: 15 April 2019 Category: Stock Market Share price at time of writing: R31.90 We take a look at listed agricultural services group, Kaap Agri's latest trading update for the period ending March 2019. A fair chunk of Kaap Agri shares are held by Zeder (PSG Group's agri investment arm).
Kaap Agri has a strong footprint in the Western Cape, which is slowly emerging from the drought that forced significant water restricitions across the whole region. So has the business recovered from the impact of the droughts? We take a look below. |

|
Related Topics |
About Kaap Agri
Kaap Agri had its origins when a few farmers in the Swartland decided to jointly buy guano (bird manure) to use as fertilizer. This led to formally establishing De Westelike Graanboeren Koörporatiewe Vereniging in 1912. Over the years the company expanded with a branch and silo network in the Swartland and the Boland. From 1930 to 1950 various other cooperatives were established in neighboring towns and areas. They all basically delivered the same functions as Wesgraan. In 1981 the first large amalgamation took place when Western Province Fruitgrowers and Wesgraan joined forces to form WP (Koörperatief) Beperk. Since then further amalgamations have taken place with Drakenstein Vrugtekwekers and Wynland Koöperasie.
In 1995 WP (Koörporatief) was converted to a public company, WPK Landbou Beperk. This was the first of the former cooperatives that converted from a cooperative to a company. In the meantime, Porterville Landboukoöperasie and Noord-Boland Koörporasie amalgamated to form Boland Agri. The current Kaap Agri had its origins when WPK and Boland Agri amalgamated in 2005. Today the Kaap Agri area of operation includes the Swartland, Boland, Wynland, Overberg, Langkloof, Namaqualand, Orange River, Sundays River Valley, Namibia, and the areas in between, as well as Limpopo, Mpumalanga and Gauteng. Therefore Kaap Agri’s area of operation is Southern Africa.
The Group specialises in trading in agricultural, fuel and related retail markets in Southern Africa. With its strategic footprint, infrastructure, facilities and client network, it follows a differentiated market approach. In support of the core retail business, the Group also offers financial, grain handling and agency services. Kaap Agri has over 200 operating points located in eight of the nine South African provinces as well as in Namibia.
The image below shows Kaap Agri's corporate profile:
Kaap Agri Corporate Profile
Trading update released by the group today
Despite the lingering pressures from the recent drought and the general subdued performance of the retail sector, Kaap Agri increased revenue for the six-month period ended 31 March 2019, by 28.7% to approximately R4.390 billion, up from R3.411 billion in the previous comparable financial period, with like-for-like comparable store sales growth of 10.7 %. The growth in the value of business transacted was driven by a 21.9% increase in the number of transactions. Product inflation, excluding the impact of fuel inflation, is estimated at -0.5%. Gross profit has not grown in relation to revenue growth due to sales mix changes, fuel price increases and margin pressure.
Agricultural conditions in the Western Cape have improved, but the sluggish recovery has led to slower than expected growth in the Country Region Agrimarks and Pakmarks. The subdued retail sector had the largest influence on the Urban Region Agrimarks. Whilst drought conditions have persisted in the Northern Cape, Inland operations have benefitted from market share gains. Wesgraan has performed well off the back of a more favourable wheat position, however the full impact of the recovery is weighted to the second half of the financial year. Mechanisation experienced a favourable uptick in the period under review. Revenue from the newly acquired Forge business is included from 1 October 2018.
Excluding the impact of Forge, non-agri retail sales have performed well, growing at 3.9% on the previous comparable period and with the exception of water storage categories coming off a large base last year as well as constrained cement sales, non-agri retail sales have delivered growth of 13.4%. Fuel retail expansion continues, taking into account the improvement of timing in respect of regulatory processes, with the outlook in this space being positive and existing and acquired sites performing well.
Group fuel volumes increased by 9.2%, of which The Fuel Company (“TFC”) owned and managed sites have grown fuel volumes by 9.5%, with additional TFC site acquisitions at various stages of conclusion. Growth in fuel site convenience and quick service restaurant retail operations has exceeded fuel volume growth.
Although both agri and non-agri retail sales have shown signs of improvement, the outlook for the remainder of the year remains dependant on normalised weather patterns and improved consumer confidence. The recovery in Wesgraan, store upgrades and expansions, as well as the revenue from new TFC sites will contribute more significantly during the next 6 months. The business remains committed to its medium-term strategic plans and continues to explore Agri, Retail and Manufacturing expansion opportunities.
The above financial information is the responsibility of the directors and has not been reviewed or reported on by the Company’s external auditors.
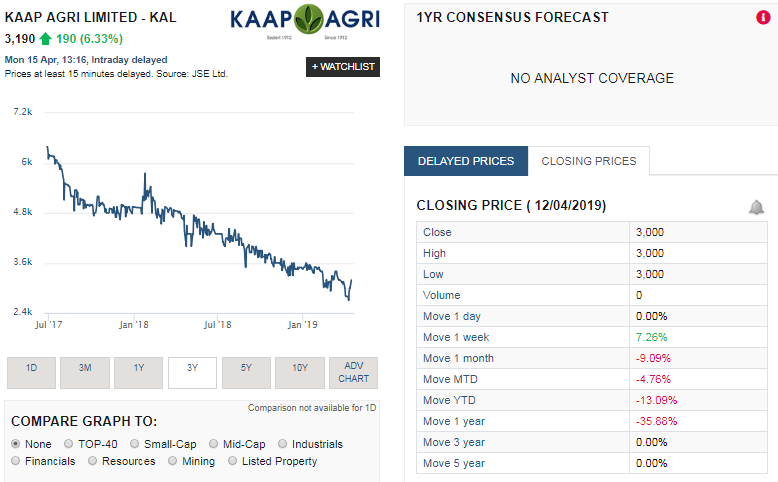
Kaap Agri (KAL) share price history
The image below shows the Kaap Agri share price history as a listed entity on the JSE. And as the image below shows, when it listed on the JSE it was trading at around R60 a share. Currently it is trading at around R30 a share. Largely thanks to the impact of the drought on the Western Cape, where the bulk of their operations are in.
While Kaap Agri reported strong revenue growth in their trading update released today, the worrying factor is this statement "Gross profit has not grown in relation to revenue growth due to sales mix changes, fuel price increases and margin pressure". Basically profits are not growing as fast as revenue due to margin pressures, fuel price increases and the sales mix of products sold. So investors shouldn't think that because Kaap Agri grew revenue by over 20% that gross and net profits for the group will grow by the same percentage.