|
Related Topics |
|
In our continued efforts to give our readers a broad number of views, opinions and information, we continue to provide PSG's daily market updates and add our own daily inputs in at the end.
|

|
Short summary of PSG's market commentary for 23 September 2019
South Africa
Despite closing somewhat higher on Friday, the JSE recorded a 1.18% loss for the week due to the unrest around the oil price and the Middle East attacks, as well as the hawkish monetary stance by the US Federal Reserve. At the closing bell, the All Share was 0.50% higher at 56 406.89 points.
United States
US markets opened slightly higher on Friday, boosted by signs of the US and China cooperating regarding the tariff war and China’s central bank cutting interest rates. At 17h50, the Dow stood 0.17% in the green.
Europe
European shares reported the fifth consecutive week of gains on Friday as investors bought into the banking and oil and gas sectors as well as Novo Nordisk, after the US approved its oral diabetes drug. At the end of trade, the STOXX 600 was up 0.29%.
Hong Kong
While Hong Kong shares were flat, Chinese stocks closed marginally higher on Friday after the Chinese central bank lowered a key lending rate slightly to negate some of the damage caused by the protracted trade dispute with the US. The Hang Seng closed down 0.13%.
Japan
Japanese indices posted a third weekly gain on Friday on the back of optimistic sentiment around easing monetary policies by the Bank of Japan. At the end of trade, 122 shares advanced while 97 declined, leading the Nikkei to close 0.16% higher.
Rand
Despite the local currency losing ground to the greenback on Friday, recording a 1.57% loss for the week, it gained 2.63% to the dollar over the past 30 days, “making it the fourth-best performing emerging-market currency tracked by Bloomberg.” At 17h50, the rand traded at R14.93 per dollar.
Precious metals
Bullion prices ended the week on a positive note as we saw increases across the board, due to investors keeping a cautious eye on the tense situation in the Middle East. At 17h50, an ounce of spot gold traded at $1 502.92.
Oil
After oil prices recorded its biggest 30-day gain in the past week because of the Saudi Arabia attacks, US shale producers “pounced on the chance to lock in future revenue for this year and next.” At 17h50, a barrel of Brent crude traded at $65.01.
Advertisement (and yes South Africans can buy from Amazon as they deliver to SA)
Our daily update
Wednesday and Thursday last week saw the South African Reserve Bank (SARB) and its monetary policy committee (MPC) meet to decide on the country's monetary policy (basically deciding on South Africa's interest rates level). The decision was made to keep South Africa's interest rates at its current levels, while more than a few market commentators and we are sure most South African citizens were calling for an interest rate cut. The image below shows South Africa's Repo fan chart.
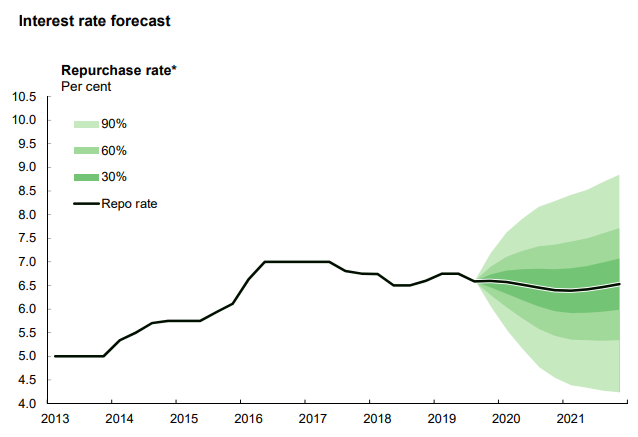
The chart above shows the forecasted path of South Africa's interest rates as well as the probability of it deviating from its forecasted path. Looking at the repo fan it seems that there is a small chance of another interest rate in the middle of 2020. But that is about it. So not a lot of relief for South African consumers from a monetary policy point of view
Our JSE All Share index daily performance calendar
Visit our JSE Calendar tracker page for a expanded version of the calendar below
The graphic below provides the daily returns of the JSE All Share Index (J203) on a calendar chart. Provides a great overview of the All share index over the course of the month. It will be updated daily with our daily investment update as received from PSG.
While the month of August was negative by -1.73% lets see what the month of September holds for the South African stock market.
So with a shorterned trading week lying ahead for South Africa the JSE All Share Index is up by 0.80% for the month of September 2019 so far. And it looks like it is struggling to hold on to the gains made earlier in the month with the last 3 trading days being negative.
There continues to be concerns about a global economic slow down largely driven by the trade ware between the US and China. Continued tariffs by the US on Chinese goods and the retaliation by China by raising tariffs on US goods keeps hurting markets and global economic growth, as the world's two biggest economies continue to stand off in this trade war.
For more on daily market movements see our 2019 Calendar tracker.
But we as South African investors are losing out in Dollar terms. Largely due to continued Rand weakness not only over the short term but over the last couple of years. We continue to advise investors to take money out of South Africa and invest it offshore. Looking for ideas for investments to make? Go read this article