|
Related Topics |
|
We take a look at the latest trading update from Exxaro in which they state that their headline earnings per share is to be between 35% and 47% higher than the previous comparable period.
|

|
About Exxaro (EXX)
In November 2006, Kumba Resources Limited unbundled and Kumba’s coal and other assets merged with Eyesizwe Coal to create Exxaro Resources Limited. We have since grown to become one of the largest and foremost black-empowered coal and heavy mineral companies in South Africa, with other business interests around the world in Europe, the United States of America, and Australia. Our asset portfolio includes coal operations and investments in iron ore, pigment manufacturing, renewable energy (wind), and residual base metals.
In the last decade, Exxaro has established itself as an organisation that is respected by its peers for its innovation, ethics, and integrity. We’ve achieved this by acknowledging that we exist in a greater context. We are here to power better lives today and tomorrow, in South Africa and beyond.
The image below shows the evolution and current company profile of Exxaro Resources
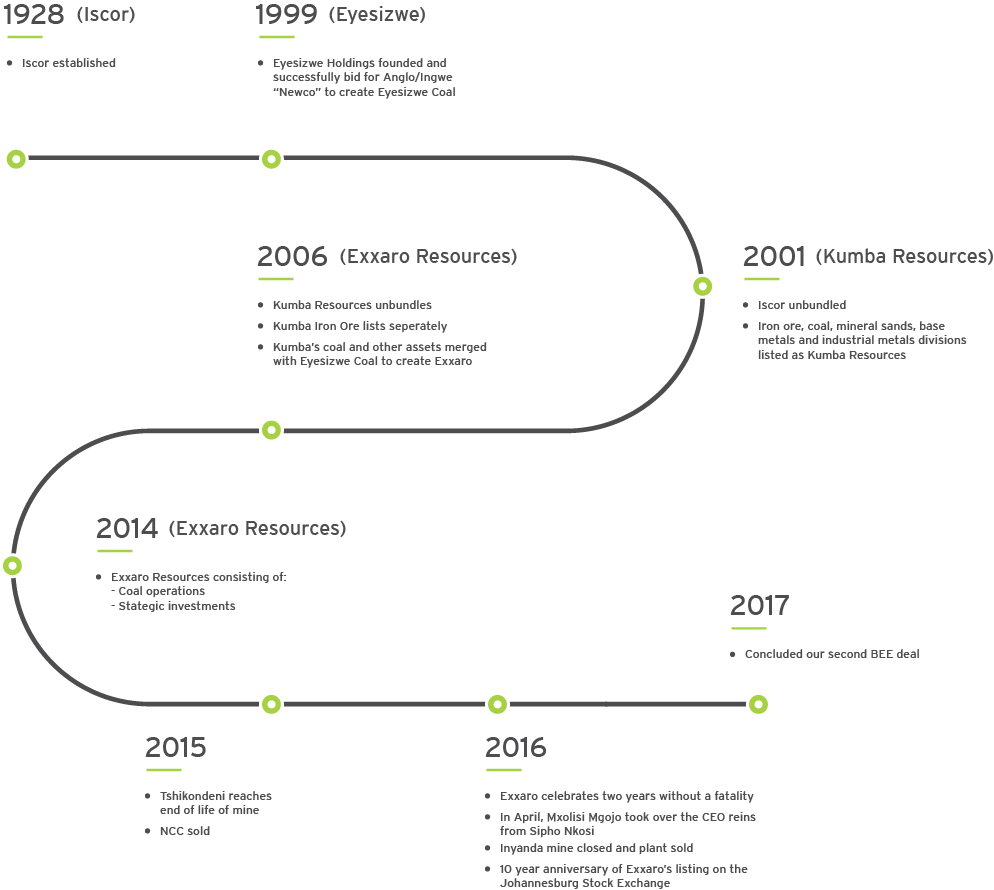
The evolution of Exxaro
Trading update from Exxaro as released on 14 August 2019
TRADING STATEMENT FOR THE SIX-MONTH PERIOD ENDED 30 JUNE 2019
Shareholders are advised that Exxaro and its directors have reasonable certainty relating to the expected financial results of Exxaro for the six-month period ended 30 June 2019. Headline earnings per share (HEPS) for the six-month period ended 30 June 2019 are expected to increase between 35% and 47%, while attributable earnings per share (AEPS) for the six- month period ended 30 June 2019 are expected to increase between 97% and 109% compared to the six-month period ended 30 June 2018.
This is mainly due to an increased contribution from our equity-accounted investments which more than offsets the lower EBITDA* contribution from our managed operations. Both HEPS and AEPS are based on a weighted average number of shares of 251 million. EBITDA for the six-month period ended 30 June 2019 are expected to decrease between 22% and 10% compared to the six-month period ended 30 June 2018.
Earnings from the coal business were adversely affected by lower domestic sales volumes, a lower average price per tonne achieved on exports due to the lower benchmark API4 price, as well as higher provision for rehabilitation and higher distribution costs. This was somewhat offset by higher export volumes and a favourable ZAR/USD exchange rate.
After adjusting for non-core items for both financial years Core HEPS** for the six-month period ended 30 June 2019 are expected to increase between 13% and 25% compared to the six-month period ended 30 June 2018. Core EBITDA** for the six-month period ended 30 June 2019 are expected to decrease between 36% and 24%, compared to the six-month period ended 30 June 2018 due to the reasons mentioned above.
Description Expected range Expected earnings for June 2019
HEPS 35% - 47% increase 1 650 – 1 796 cents
AEPS 97% - 109% increase 2 498 – 2 650 cents
EBITDA 22% - 10% decrease 2 937 – 3 389 (R Million)
Core HEPS*** 13% - 25% increase 1 131 – 1 251 cents
Core EBITDA 36% - 24% decrease 2 544 – 2 994 (R Million)
Shareholders are advised that Exxaro will release its reviewed financial results for the six-month period ended 30 June 2019 on 22 August 2019. Further details are available on our website, www.exxaro.com. The forecast financial information on which this trading statement is based has not been reviewed, audited nor reported on by Exxaro’s external auditors.
This statement is issued in compliance with the JSE Listings Requirements. *EBITDA is calculated by adjusting net operating profit before interest, tax, depreciation, amortisation, impairment charges and net loss or gain on disposal of investments and assets (including translation differences recycled to profit or loss).
**Core HEPS and core EBITDA are calculated after adjusting for non-core items. Core HEPS is based on a core weighted average number of shares of 332 million which is calculated by deducting Exxaro’s 24.9% shareholding in Eyesizwe RF Proprietary Limited from Exxaro’s total shares in issue. *** Core AEPS are the same as core HEPS. These are not defined terms under International Financial Reporting Standards (IFRS) and may not be comparable with similarly titled measures reported by other companies. The afore-mentioned adjustments are the responsibility of the directors of Exxaro. The adjustments have been prepared for illustrative purposes only and due to their nature, may not fairly present Exxaro´s financial position, changes in equity, results of operations or cash flows.
Editor’s note: Exxaro is one of the largest South African based diversified resources companies, with interests in the coal, titanium dioxide, iron ore and energy. www.exxaro.com
End trading statement
Confusing trading statement so which number should I look at?
The trading statement reports both increases and decreases so which number should one look at. We tend to favour Headline Earnings per share (HEPS) as it excludes once off items such as sale of assets etc. so for us it is the truest reflection of the group's earnings. And they take it a step further and report Core HEPS. So this refers to their headline earnings per share of their core business (so it excludes their shareholding in Eyesizwe RF). And both HEPS and CoreHEPS shows that their earnings will increase but the level of increase is significantly different.
Share Price Performance of Exxaro (EXX)
The screenshot below, taken from Sharenet shows the share price history of Exxaro for the last three years as well as the share price performance over various time periods
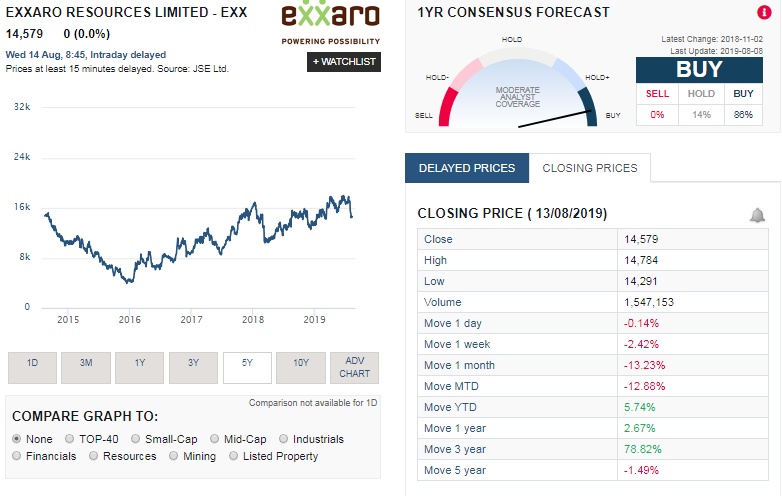
The summary below shows the performance of Exxaro's share price over various time periods:
So its pretty clear that the share price performance of EXX over the last three years has rewarded investors handsomely. However struggling markets over the last few weeks has seen EXX share drops significantly as can be seen with the returns of the share price over the last month sitting at -13.23%
- 1 week: -2.42%
- 1 month: -13.23%
- Year to date (YTD): 5.74%
- 1 year: 2.67%
- 3 year: 78.82%
- 5 year: -1.49%
So its pretty clear that the share price performance of EXX over the last three years has rewarded investors handsomely. However struggling markets over the last few weeks has seen EXX share drops significantly as can be seen with the returns of the share price over the last month sitting at -13.23%
Exxaro (EXX) shares valuation as at 15 March 2019
So what are Exxaro shares worth based on their bumper set of financial results? We are a little concerned about the fact that they are stating they cannot compete against product supplied by certain countries such as Colombia. The worry is the oversupply of coal to big coal users. All this will do is force down international coal prices which will eat into the currently very health profit margins of Exxaro.
All things considered, including their low PE ratio, strong dividend yield, their massive global footprint in terms of where they can sell their product we value the group's share at R203 a share. That will place the group on a PE ratio of 9.4 and a dividend yield of 5.34%, neither of which is demanding at that price. We therefore feel Exxaro shares at their current price offers good value for investors.
Read the full valuation here