|
Related Topics |
|
This article will take a look at our in house developed Economic Progress Index(EPI). The EPI is designed to measure if South Africa's economy is improving (based on 2010 as our starting point) and by improving we are talking not only about economic growth, but is it addressing issues such as unemployment, national government deficits, are we as a country producing more (in terms of volume of goods) and comparing growth in volumes produced to South Africa's population growth rates. We also add the exchange rate into the mix as this the most direct sign of sentiment and confidence the rest of the world has in South Africa as a country and it's economy.
|
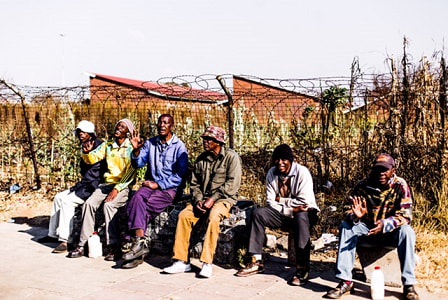
Beggars sitting next to the road in South Africa
|
So which variables are included in the EPI?
GDP: This is the official economic growth rate of South Africa
Exports: Total value of goods exported out of South Africa
Imports: Total value of goods imported into South Africa
Volume of goods produced: Statistics SA publishes and index that measures the total volume of goods produced by South African manufacturers.
Unemployment Rate: The official unemployment rate as published by Statistics South Africa.
Population: This revers to South Africa's mid year population estimates.
Exchange Rate: Rand/US Dollar Exchange rate
Current account: Well the best way to explain what the current account is, is actually via a definition from Investopedia.com
According to their wording a current account is "defined as the sum of the balance of trade (goods and services exports less imports), net income from abroad and net current transfers. A positive current account balance indicates that the nation is a net lender to the rest of the world, while a negative current account balance indicates that it is a net borrower from the rest of the world"
Budget Deficit/Surplus: This refers to the South African government's budget deficit or surplus. Is it getting in more in taxes than it is spending (surplus), or is it spending more than what it is getting in (deficit).
The above variables were selected as it covers a wide range of economic indicators of South Africa and should provide a more detailed and broader perspective of South Africa's economic progress over time. The variables are indexed to ensure 2010=100 and each variable is given an equal weighting to ensure no single variable has a bigger influence on the EPI than the other. Applying weights to these 9 variables would be a purely subjective practice.
The graphic below shows the index level of our EPI from 2010 to estimated for 2018 (based on available data). It will be updated as new data points become available.
As can be seen from the graphic above, based on our EPI, South Africa's economy has not made any progress since 2010, in fact it has been going backwards based on the variables included in our EPI model. The EPI is current down 20.2% from its starting point in 2010. It's no real surprise then that South Africans are looking for change and new ideas when it comes to reviving South Africa's ailing economy.
The chart below shows the year on year growth rates of the EPI, plotted against the year on year growth rates in South Africa's officially published economic growth rate.
The chart below shows the year on year growth rates of the EPI, plotted against the year on year growth rates in South Africa's officially published economic growth rate.
As can be seen from the bar chart below, while the GDP figures remained positive our EPI showed sustained negative growth over from 2010 to 2014, however our EPI has shown positive growth in 2016, but saw a significant decline again in 2017. The appointment of Cyril Ramaphosa and the removal of Jacob Zuma as president of South Africa during the early stages of 2018 has been seen as a very positive move for South Africa. And some of that seems to have filtered through the EPI, with the EPI for 2018 (based on all available data for 2018) showing a slight increase on the levels recorded in 2017. But the GDP numbers for 4th quarter 2018 still has to be published, and we suspect load shedding that was implemented towards the end of last year will hurt the GDP numbers and therefore the final EPI for 2018.
As mentioned earlier the EPI has lost about -20.2% from its base in 2010, so we are saying the overall economic progress of South Africa has declined by -20.2% since 2010 based on what we import and export, our country's finances, the exchange rate, our production capacity and our population growth.
But winning that ground back is becoming ever harder for South Africa. Budget deficit is ballooning thanks to lack luster economic growth which is hampering tax revenue collections, bailing out failing State Owned Enterprises (SOE's) such as SAA, ESKOM, SANRAL, DENEL etc and large scale corruption in which money is funneled to line cronies pockets instead of it being spent effective and efficiently to deliver goods and services to the people of South Africa.
While numerous commissions have been set up by the new President of South Africa, Cyril Ramaphosa, very little has been done in terms of prosecuting high ranking officials for fraud, corruption , racketeering and the likes. At some point if South Africa wants to show it is serious about tackling these issues, prominent figures will need to be prosecuted and jailed for wrong doing, else the rot that has set in will continue unabated, while more and more people are getting fed up with the lack of economic transformation and emancipation 25 years after the end of Apartheid.
*Note the EPI is the intellectual property of SouthAfricanMi.com. Should you want to use the data and graphics please ensure SouthAfricanMi.com is credited.