|
|
Related Topics |
About Capitec Bank
Our philosophy is to offer equal access to affordable banking that is simple to understand, transparent and that helps our clients improve their financial lives. We make no distinction between our clients and give everyone the opportunity to bank where and when they want, whether digital or in a branch. The South African banking landscape has evolved rapidly over the past couple of years.
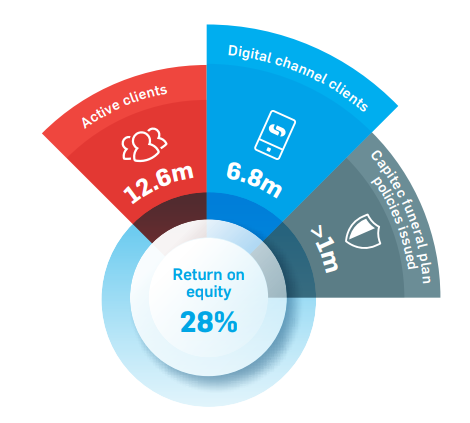
Digitalisation has resulted in approximately 6.8 million clients now making use of our digital channels (banking app and USSD (primarily for feature phones)) up from 4.7 million at the end of August 2018. Our dedication to satisfying our clients’ digital banking needs was affirmed when we were voted as South Africa’s best digital bank of 2019 by Columinate’s SITEisfaction® survey. Branches are an essential need and are relevant to our clients. We have 834 branches across the country in convenient locations and approximately 6 million clients visit our branches every month.
We have converted 122 branches where we have removed the cashier and implemented a full self-help functionality. This enabled us to add an additional consultant workstation for further capacity in the branch. Altogether 21 new branches are scheduled to open during the second half of this financial year. The delivery on clients’ needs through personalised service has resulted in an average client growth of almost 200 000 per month over the last 6 months. We now have 12.6 million active clients. Since February 2019, 149 employees have joined our team and we now employ 13 923 people. We have had no retrenchments and do not plan any either. Through our commitment to providing solutions that are simple, accessible and affordable, we continue to make a meaningful contribution to the financial well-being of our clients and the sustainability of our business.
Overview of Capitec's financial results
- Net lending, investment and insurance income: R6.306 billion (up 3% from R6.112 billion for the same period of the previous year)
- Operating expenses: R4.003 billion (up 14% from R3.500 billion for the same period of the previous year
- Profit for the year: R2.953 billion (up 20% from R2.459 billion for the same period of the previous year)
- Diluted earnings per share: R25.45 (up 20% from R21.18 for the same period of the previous year)
- PE ratio: 25
- Dividend declared: R7.55
- Dividend yield. 1.1%
- Dividend yield. 1.1%
- Cash generated from operations: R11.818 billion
- Cash generated from operations per share: R102
- Cost to income ratio: 40%
- Return on equity: 28%
- Net asset value: R200.44
- So Capitec is trading at 6.33 times its stated net asset value. Firms tend to trade at between 2 to 4 times its stated net asset value. So Capitec is trading above the "norm"
- Net credit impairment charge: 3.6%
- Number of Capitec branches: 834 (up from 832 for the same period of last year)
- Number of Capitec employees: 13 923 (up from 13 710 for the same period of last year)
- Active clients: 12.6 million (up from 10.52 million for the same period of last year)
- Total ATM's: 5 309 (up from 4 912 for the same period of last year)
Capitec's management commentary on the results
Retail deposits growth
During this 6-month period we paid out R2.28 billion (August 2018: R1.86 billion) in interest on retail call deposits, fixed deposits and positive credit card accounts. Retail deposits increased by 23% to R81.4 billion (August 2018: R66.2 billion) which is a reflection of our clients’ trust in our brand. Industry reports indicate that there is approximately R295 billion in South Africa in transactional accounts earning no interest. If that money earned just 4.75% interest it would put over R14 billion extra into the pockets of South Africans every year. Our clients currently earn between a minimum of 4.75% and 8.55% interest per year on any positive balance on their accounts. Depositors’ money invested in retail call deposits is not utilised to fund credit granting, which is funded by wholesale funding, retail fixed deposits and retained earnings. Wholesale funding decreased by 32% during the current period to R3.95 billion (August 2018: R5.77 billion). It was deliberately managed lower due to strong retail fixed deposits and earnings growth. We issued a bond of R500 million and received bids totalling R2.75 billion, which is 550% of what we asked for. We will always retain some wholesale funding as an element of our funding.
Gross loan book and arrears
The gross loan book increased by 17% to R60.25 billion for the period from R51.36 billion in the prior period. The total arrears up to 3 months decreased by 11% to R2.16 billion at the end of August 2019 (August 2018: R2.43 billion; February 2019: R2.57 billion). On an annualised basis, the credit loss ratio decreased to 7.2% for the current period compared to 10.2% in the 6 months ended August 2018 (February 2019: 8.6%). Gross loans and advances in arrears by more than 3 months and loans with legal statuses (debt review and handed over) grew to R6.99 billion compared to R3.07 billion at the end of August 2018. The increase is due to IFRS 9.
Prospects
Our focus on delivering simple, affordable, accessible solutions to our clients through personal service will remain, not only through our retail bank, but also through our business bank in the near future. We believe in a positive long-term view of South Africa, that is why we look forward to integrating Mercantile Bank. Announcements regarding the final approval of the Mercantile Bank acquisition and related details will be made via the Johannesburg Stock Exchange News Service (SENS). We will continue to use digital innovation and artificial intelligence to ensure that we provide our clients with the best digital banking and payment solutions, as well as improve our client insights.
Share price history of Capitec Bank
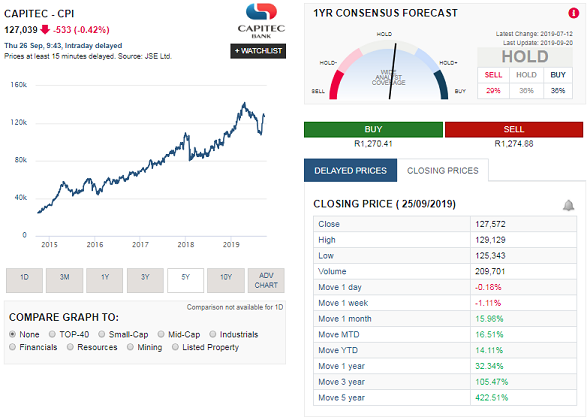
The image below shows the share performance of Capitec over the last 5 years, and as the image shows its been a mostly upward trajectory in the share price of Capitec Bank. The summary below shows the share price performance of Capitec Bank over various time periods
The above shows just how Capitec Bank shares have rewarded long term investors in the bank, with it providing a phenomenal 422% over the last 5 years (excluding dividends) but just share price gains.
- 1 week: -1.11%
- 1 month: 15.96%
- Year to date (YTD): 14.11%
- 1 year: 32.34%
- 3 years: 105.47%
- 5 years: 422.51%
The above shows just how Capitec Bank shares have rewarded long term investors in the bank, with it providing a phenomenal 422% over the last 5 years (excluding dividends) but just share price gains.
Share valuation of Capitec (CPI)
So the big question is what are Capitec shares actually worth? Do they offer any value at their current price considering the very strong run the shares have had over the last 5 years? Does the growth in Capitec's profits corrospond to the growth in the share price, or is the share price running hot and due for a pull back? Based on Capitec's latest financial results and their prospects our valuation model provides a target (full value) price for Capitec Bank at R1220.
We therefore believe that Capitec Bank's shares is overvalued and we would not recommend long term fundamental or value investors buy into the group's shares at its current price. We suggest looking to enter at least 10% below our target price, which in this case is R1220. A good entry point would therefore be around R1098 a share
We therefore believe that Capitec Bank's shares is overvalued and we would not recommend long term fundamental or value investors buy into the group's shares at its current price. We suggest looking to enter at least 10% below our target price, which in this case is R1220. A good entry point would therefore be around R1098 a share