|
Related Topics |
|
We take a look at a rapid response survey conducted by Statistics South Africa in which businesses were asked various questions relating to the impact Covid-19 and the national lockdown will have on their business.
Note the results of this survey is base on a very small sample of firms that responded and this is a an experimental survey conducted over a very short period of time |

|
Overview of the rapid response survey
The COVID-19 pandemic has created profound disruptions to our economy and society. Many South African industries are experiencing an adverse impact from the pandemic, which is consistent with other countries fighting the disease. In its response to the crisis, the South African government has (from 27 March 2020) placed the country under a national lockdown to reduce the spread of the virus, resulting in the closure of many businesses. The businesses affected by the national lockdown are those that are not regarded as providing essential services. These industries include, amongst others, those reliant on the movement of goods (supply chain disruptions), the telecommunications sector, selected mining activities due to a decrease in demand for minerals, accommodation and tourism due to travel bans, construction, transport, and various services.
Measuring the impact of the pandemic on the economy will depend heavily on information and related facts provided by businesses who complete surveys conducted by Statistics South Africa (Stats SA). The actual impact remains unknown until critical variables can be identified, including the duration of the pandemic and its intensity in terms of infection rates. The pandemic has highlighted the need to obtain accurate information as close as possible to real time. Accordingly, Stats SA has set out to determine the impact on businesses and the economy at large by conducting an experimental study.
The business impact study is administered through a basic survey focusing on financial performance related to the trading status, business impact, turnover, import and export of goods, purchases, price changes, financial burden and assistance, business survival, and workforce. The results include the aggregated responses from businesses based on a series of questions
Key results of the business impact survey
Key results
- The majority of responding businesses (85,4%) reported turnover below the normal range. 46,4% indicated temporary closure or paused trading activity.
- 50,4% expected their workforce size to stay the same in the two weeks after the survey, while 36,8% reported that their workforce size is expected to decrease.
- 28,3% indicated that their workforce has decreased working hours and 19,6% reported laying off of staff in the short term.
- 19,1% indicated that prices of materials, goods or services purchased increased more than normal.
- Access to financial resources: 23,8% indicated a decrease while 52,6% indicated access to financial resources remained the same.
- 38,2% of businesses applying for financial assistance reported that they would use government relief schemes.
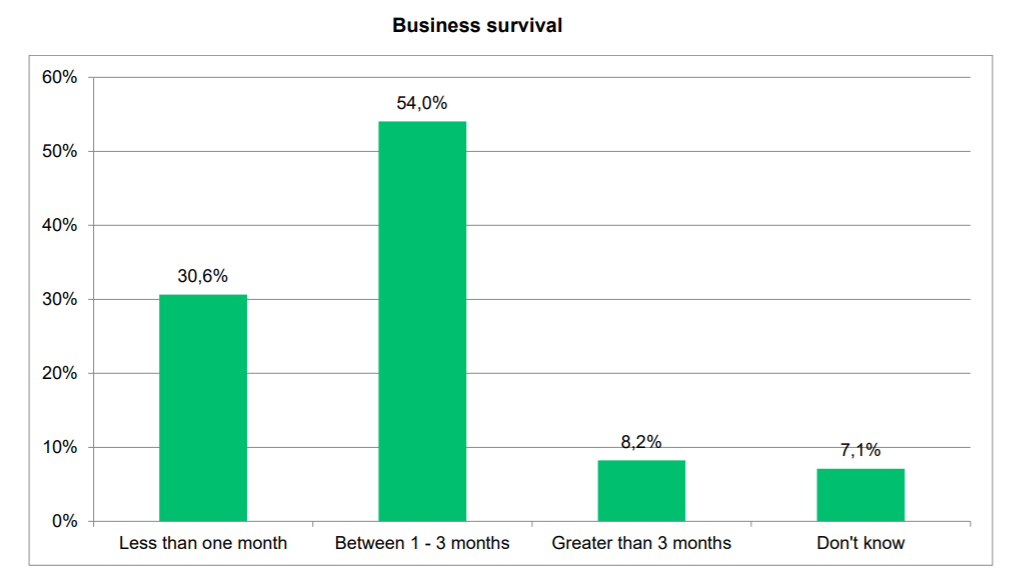
- 30,6% indicated they can survive less than a month without any turnover, while 54,0% can survive between 1 and 3 months.
- 46,3% of the workforce were able to meet business demands, and 43,0% of the workforce were not able to meet business demands (the rest reported ‘unsure’).
Financial performance
Turnover relates to the income generated by a business when conducting its core operations within a specified timeframe, and forms a key measure of business performance. According to the Annual Financial Statistics survey conducted by Stats SA, turnover includes sales of goods, services rendered, leasing and hiring of capital assets, and rental/leasing of land, buildings and other structures. The survey showed that 85,4% of responding businesses had turnover that was lower than their normal range; 1,3% reported that turnover was higher than their normal range; and 13,3% reported that turnover was within their normal range (see image below). This was for the two-week reference period covered by the survey.
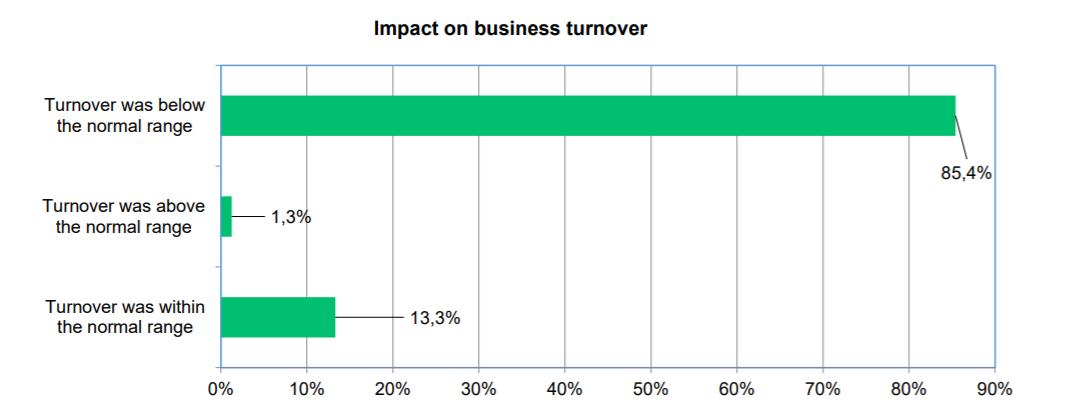
Figure 2 shows a widespread adverse impact of the COVID-19 pandemic on business turnover across all industries. The industries reporting the highest proportions within the normal range were mining and quarrying; electricity, gas and water; and community, social and personal services. A limited number of respondents operating within the manufacturing, construction and trade sectors indicated that their turnover was above the normal range. The sub-sectors that indicated turnover above the normal range included architectural and engineering services, manufacturing of grain mill products, manufacturing of chemicals, and trade in household goods.
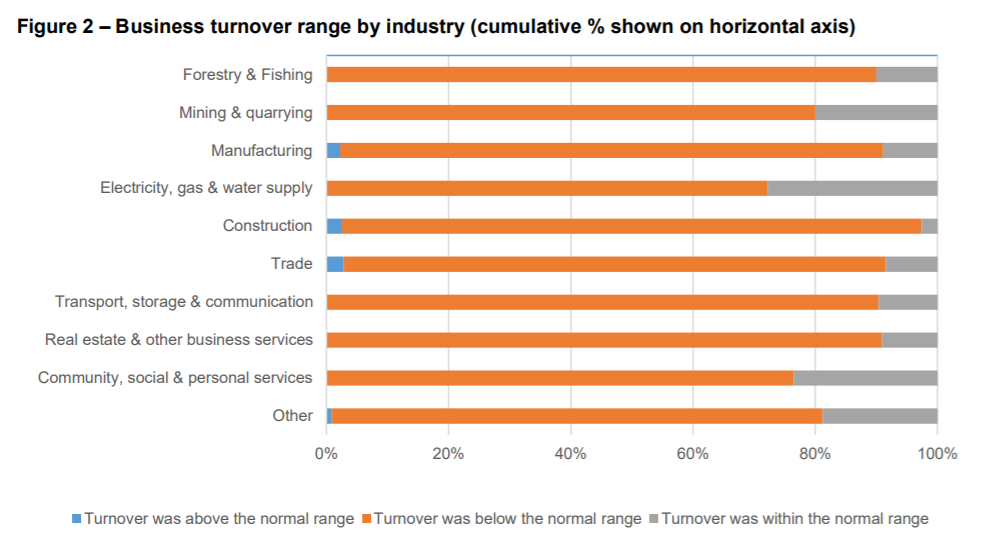
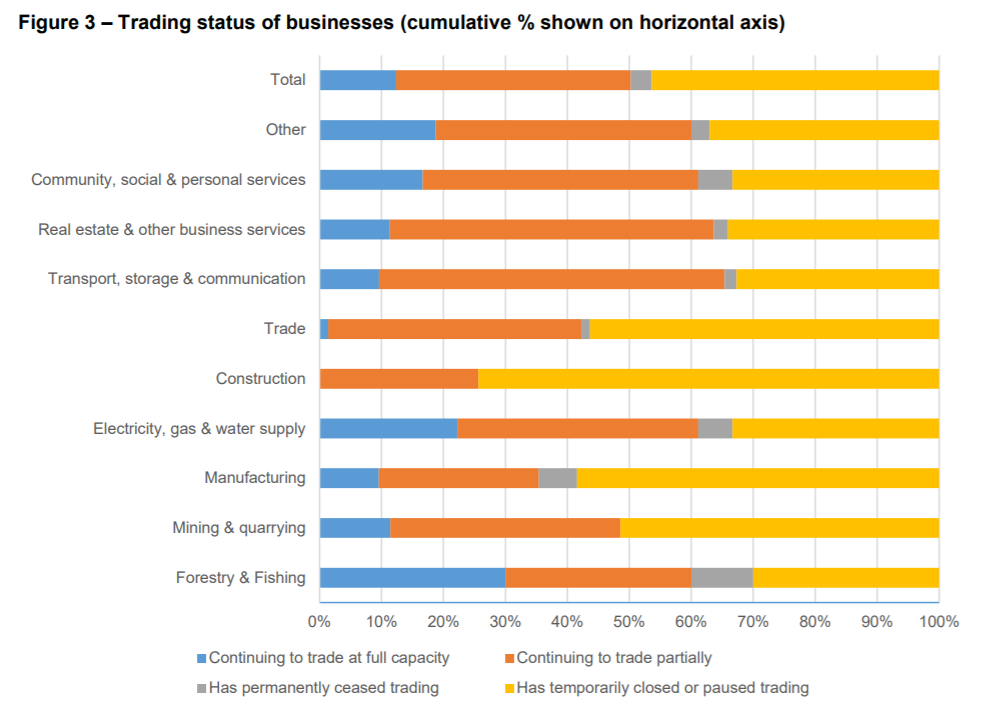
Figure 3 shows that a low proportion of businesses continued to trade at full capacity. The proportion trading at full capacity ranged from zero in construction to 30,0% in forestry and fishing, and the total was 12,3%. Almost half (46,4%) reported ‘temporarily closed or paused trading’
Workplace implications
The full impact of the COVID-19 pandemic on employment will be determined over time; employment tends to be a lagging economic indicator. Particularly vulnerable are workers with underlying health conditions and those more sensitive to labour market conditions, e.g. construction workers. Businesses were requested to indicate their expectations with regard to changes in workforce size due to the pandemic – see Figure 4.
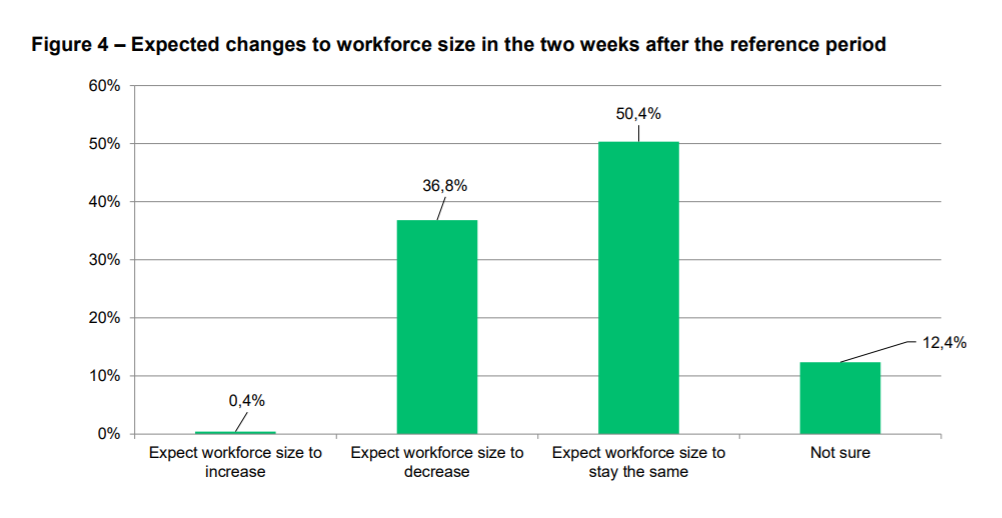
Results from the survey indicate that 50,4% of businesses expected their workforce size to stay the same over the two weeks after the reference period, 36,8% reported that their workforce size is expected to decrease, 12,4% were not sure, and 0,4% expected their workforce size to increase. Businesses were also requested to indicate what measures were taken to cope with the impact of COVID-19 on their workforce, illustrated in Figure 5
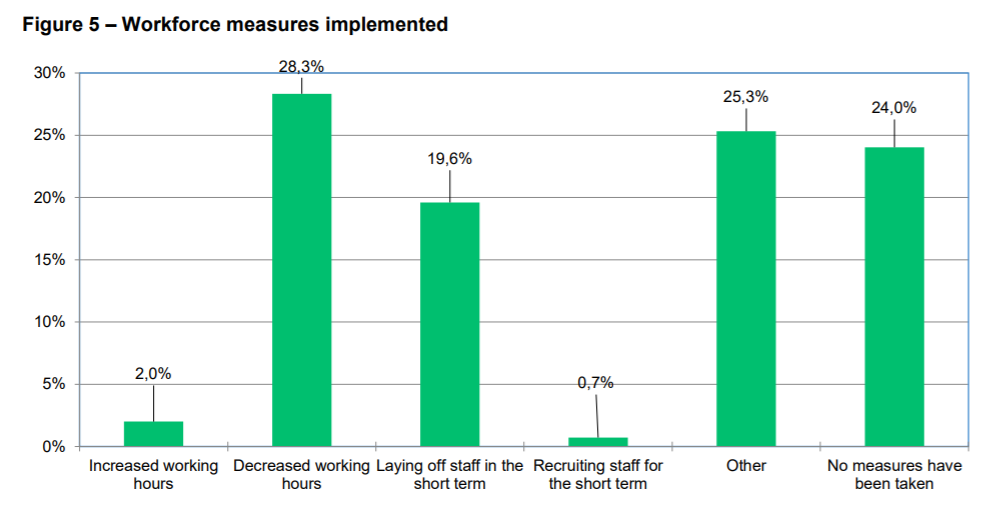
Approximately half of respondents indicated either decreased working hours (28,3%) or laying off of staff in the short term (19,6%); 25,3% reported ‘other’ measures taken; 24,0% reported no measures taken; 2,0% reported increased working hours; and 0,7% will be recruiting staff in the short term.
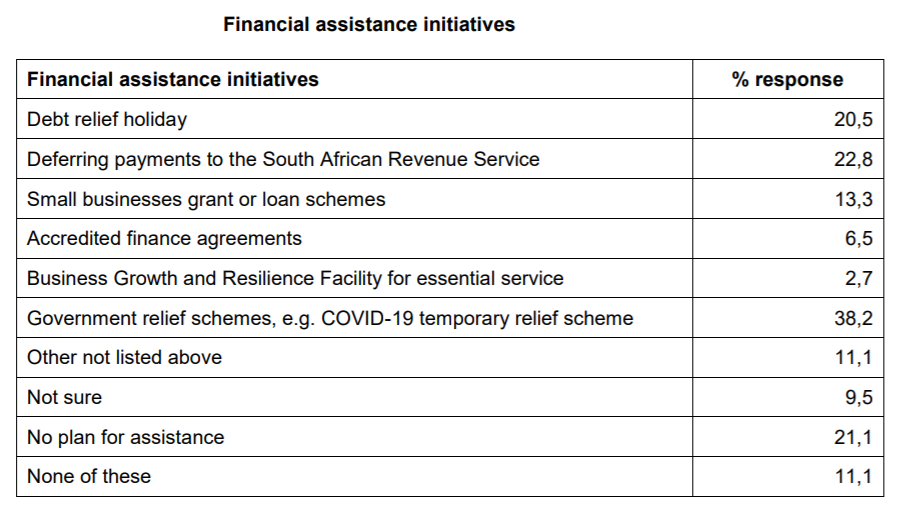
Financial assistance initiatives during Covid-19
Approximately 38% of businesses applying for financial assistance reported that they would use government relief schemes, and approximately 23% reported deferring payments to the South African Revenue Service. See the table below that touches on responses to financial assistance initiatives
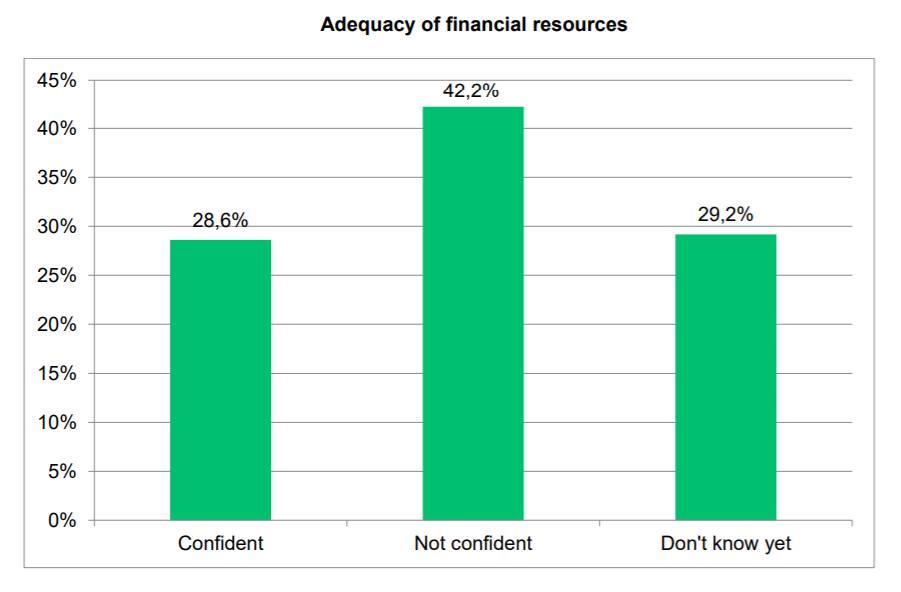
Over 40% of businesses indicated that they are not confident that their business has the financial resources to continue operating throughout the COVID-19 pandemic. 28.6% of respondents stated that they are confident that they have the financial resources to continue operating throughout the Covid-19 pandemic. See the image below
Business survival without turnover: 54,0% of businesses indicated they can survive between 1 and 3 months. But the worrying number is the 30.6% of businesses that said that would survive for less than 1 month of they didn't receive any turnover. One it shows how many firms operate on the margin between survival and closure and two it brings up questions regarding firms cash flow management.
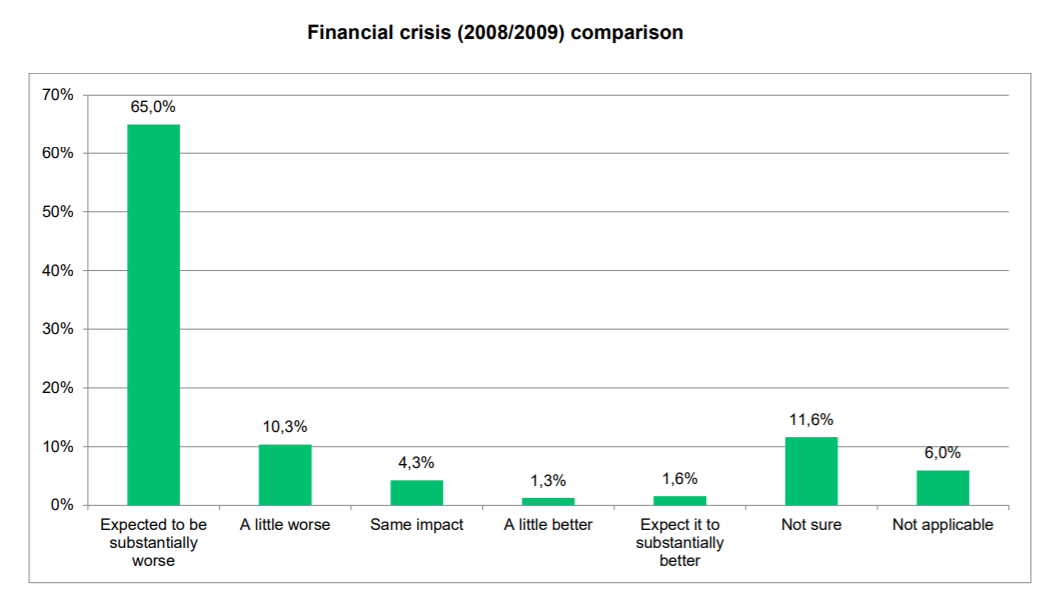
Covid-19 vs Financial Crisis
The graphic below shows that a large percentage of firms (65%) believe that the impact of Covid-19 will be far worse on them than the financial crisis in 2008/2009. 10.3% believe the impact of Covid-19 will be only a little worse than the 2008/2009 financial crisis. 4.3% said the impact will be the same, while 1.3% said they expect the impact to be a little better than the financial crises and 1.6% said they expect it to be substantially better than the financial crisis.