South African Market Insights
  • Home
  • Blog
    • Blog-5Jun2018
    • Blog-18May2018
    • Blog-16May2018
    • Blog-3May2018
    • Blog-2May2018
    • Blog-30Apr2018
    • Blog-26Apr2018
    • Blog-24Apr2018
    • Blog-18Apr2018
    • Blog-17Apr2018
    • Blog-16Apr2018
    • Blog-3Apr2018
    • Blog-22Mar2018
    • Blog-20Mar2018
    • Blog-19Mar2018
    • Blog-23Oct2017
    • Blog-20Oct2017
    • Blog-11Oct2017
    • Blog-10Oct2017
    • Blog-6Oct2017
    • Blog-3Oct2017
    • Blog-2Oct2017
  • Economics
    • Rand Dollar Exchange Rate
    • South Africa's GDP
    • South Africa's Unemployment
    • SA by numbers
    • Economic Progress Index
    • Taylors Rule
    • South Africa's Formal Business Sector
    • South-Africa's-Fiscal-Policy
    • SA EU Trade Data
    • Inflation Heat Map
    • Population Density Map
    • Labour Market Dynamics
    • Estimating the Size of the Informal Economy
    • SA Consumer Spending Patterns
    • South Africa's Monetary Fiscal Policy Mix
    • GDP Animations >
      • SouthAfrica
      • WesternCape
      • EasternCape
      • NorthernCape
      • FreeState
      • KwaZuluNatal
      • NorthWest
      • Gauteng
      • Mpumalanga
      • Limpopo
    • South Africa's Economic Structure
    • South Africa's Economic History
    • South Africa's Trade Data Page
    • South Africa's Food and Beverages Sector
    • Financial Well-being of South African Companies_2015
    • SA vs the World
    • Budget Day Page (24 Feb 2016)
  • Stock in Focus
    • JSE ALSI Chart
    • Sector Comparison Page
    • JSE-Calendar-Tracker-2019
    • Adcorp (ADR)
    • Amazon (AMZN)
    • Apple (AAPL)
    • Ascendis (ASC)
    • AVI (AVI)
    • Bidvest (BVT)
    • Blue Label Telecoms (BLU)
    • Bowler Metcalf (BCF)
    • Capitec (CPI)
    • City Lodge Hotel Group
    • Clicks Group (CLS)
    • Coronation (CML)
    • Curro Holdings (COH)
    • Discovery (DSY)
    • Distell (DST)
    • EOH (EOH)
    • Famous Brands (FBR)
    • Ferrari (RACE)
    • FirstRand Group (FSR)
    • Grindrod (GND)
    • GrowthPoint (GRT)
    • Holdsport (HSP)
    • Harley-Davidson (HOG)
    • Hyprop (HYP)
    • Hyprop (HYP)_1Jun2016
    • Investec Property Fund (IPF)
    • JSE (JSE)
    • Massmart (MSM)
    • MediClinic (MEI)
    • MTN (MTN)
    • MTN (MTN)_May2016
    • Mr Price Group (MRP)
    • Mr Price Group (MRP)_8APR2016
    • Nedbank (NED)
    • OneLogix (OLG)
    • Peregrine Holdings (PGR)
    • Pick 'n Pay Stores (PIK)
    • Pioneer Foods (PFG)
    • PSG Group (PSG)
    • Quantum Foods (QFH)
    • RCL Foods (RCL)
    • Remgro (REM)
    • Richemont (CFR)
    • RMB Holdings (RMH)
    • Rolfes (RLF)
    • Sanlam (SLM)
    • Sasol (SOL)
    • Sasol (SOL)_18sep2016
    • Santova (SNV)
    • Spar Group (SPP)
    • Shoprite Holdings (SHP)
    • Spur Corporation (SUR)_7Sep2017
    • Standard Bank (SBK)
    • Steinhoff International Holdings (SNH)
    • Stor-Age (SSS)
    • Super Group (SPG)
    • Taste Holdings (TAS)_30May2016
    • The Foshini Group (TFG)
    • Value Logistics (VLE)
    • Vodacom (VOD)
    • Wilson Bayly Holmes Ovcon (WBO)
    • Woolworths (WHL)
    • Woolworths (WHL)_24Aug2017
    • Zeder (ZED)
  • Online Calculators
    • Rand Petrol Price Estimator
    • Share Valuation
    • Financial Ratios Calculator
    • GDP Growth Estimator
    • Future Value of Investment Calculator
    • Loan repayment calculator
  • Contact
  • About
  • Search

< What the Big Mac index says about the value of the rand
Monetary Fiscal Policy Mix >

Gross Fixed Capital Formation and SA's GDP just how linked are they

Category: Economics 
Date: 6 May 2018 

Related Topics

In today's blog we take a look at the latest gross fixed capital formation  (GFCF) numbers in South Africa and how this is closely tied to South Africa's economic growth. A lack of investment in fixed assets and assets used to generate income or used in the production process will inevitably mean declining or slowing economic growth rates. And alternatively, declining or slowing growth rates will lead to declining GFCF.
​
This is why it is important that government, local companies and foreign companies invest in country to stimulate and maintain economic growth. Sadly this has hardly been the case for South Africa in recent years. And the impact on South Africa's GDP is clear.
SA's GDP compared to SA's gross fixed capital formation
  • SA vs The World
  • ​Sector Comparison Page
  • ​Inflation Heat Map
  • Spending Patterns of consumers

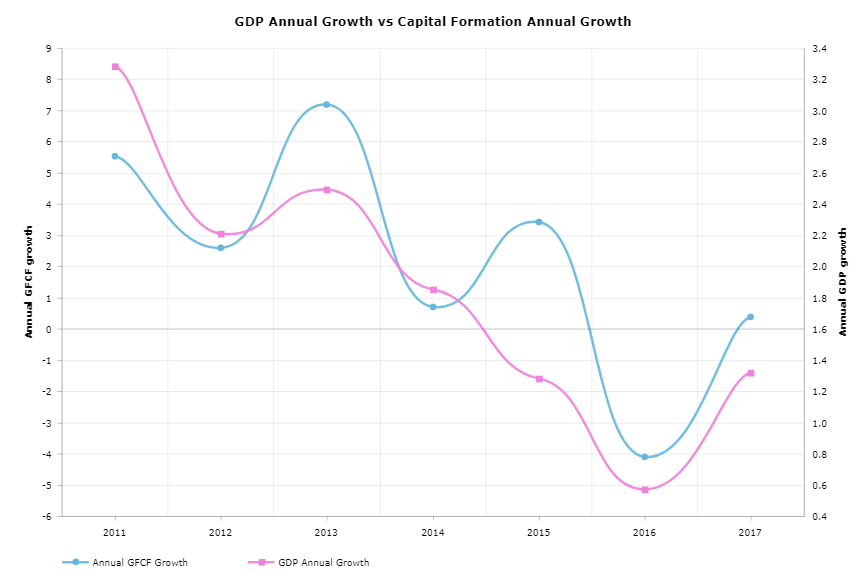
GFCF vs South Africa's economic growth rate (GDP)

The graphic below shows the annual growth rate in South Africa's total gross fixed capital formation and South Africa's annual GDP figures. Note the figures used for the calculation of the growth rates are 2010 Constant prices (I.e inflation removed from the numbers and expressed in 2010 prices).
chart created with amCharts | amCharts
As the line graph above indicates the trend in GFCF and GDP growth rates are very similar. And it is obvious that there is a strong correlation between the two. Now without testing for causality one will never be sure if GDP growth affects GFCF or does GFCF affect GDP? Its very similar to the chicken or egg argument.  Was the chicken there first and laid the egg or did the chicken come from the egg?

So in which type of assets has capital formation and investment declined? And in which type of assets have investments increased?  Are South African companies investing in new buildings, machinery and equipment, new transport equipment etc? The graphic below takes a look at the main asset types considered in the GFCF data as well as the growth from 2010 to end of 2017 as well as the total Rand value of investment ​ in these various assets.

chart created with amCharts | amCharts
The bar chart above shows strong growth for certain asset types, but significant declines an relatively slow growth for others. Especially considering the fact that the growth above reflects total growth over a 7 year period. Below a summary of the various asset types and the growth over the last 7 years. It is sorted in descending order (from strongest growth to weakest growth) over the 7 year period.
  • Computers and related equipment: 113.2%
  • Computer software: 49.5%
  • Research and development: 39.7%
  • Transport equipment: 33.2%
  • Construction works: 27.7%
  • Total: 16.4%
  • Residential buildings: 13.1%
  • Transfer costs: 11.9%
  • Cultivated biological resources: 11.8%
  • Machinery and other equipment: -0.9%
  • Non-residential buildings: -12.7%
  • Mineral exploration: -42.2%

Worrying for South Africa is the fact that non-residential buildings, think factories, office blocks, warehouses etc capital formation has actually declined by almost 13% over the last 7 years. Not exactly a sign that companies and foreign investors have confidence in a country and it's economy. And the latest proposal of land expropriation without compensation will hardly inspire any confidence in companies or investors looking to invest in South Africa. Why would they if their property and ownership rights cannot be protected?

Interestingly but hardly surprising is the fact that the top two assets in terms of growth in capital formation over the last 7 years were computer and related equipment as well as its software. An indication that South Africa's working environment is being more machine and computer intensive, which means there is less space for employing people which will make South Africa's stubbornly high unemployment rate even harder to address.

Let us know what you thought of this article:


Additional content:

Related Topics

  • ​Rand Dollar Exchange Rate


​Homepage

Economics Page
Stock in Focus Page


​About


Contact Us

Copyright © 2015
  • Home
  • Blog
    • Blog-5Jun2018
    • Blog-18May2018
    • Blog-16May2018
    • Blog-3May2018
    • Blog-2May2018
    • Blog-30Apr2018
    • Blog-26Apr2018
    • Blog-24Apr2018
    • Blog-18Apr2018
    • Blog-17Apr2018
    • Blog-16Apr2018
    • Blog-3Apr2018
    • Blog-22Mar2018
    • Blog-20Mar2018
    • Blog-19Mar2018
    • Blog-23Oct2017
    • Blog-20Oct2017
    • Blog-11Oct2017
    • Blog-10Oct2017
    • Blog-6Oct2017
    • Blog-3Oct2017
    • Blog-2Oct2017
  • Economics
    • Rand Dollar Exchange Rate
    • South Africa's GDP
    • South Africa's Unemployment
    • SA by numbers
    • Economic Progress Index
    • Taylors Rule
    • South Africa's Formal Business Sector
    • South-Africa's-Fiscal-Policy
    • SA EU Trade Data
    • Inflation Heat Map
    • Population Density Map
    • Labour Market Dynamics
    • Estimating the Size of the Informal Economy
    • SA Consumer Spending Patterns
    • South Africa's Monetary Fiscal Policy Mix
    • GDP Animations >
      • SouthAfrica
      • WesternCape
      • EasternCape
      • NorthernCape
      • FreeState
      • KwaZuluNatal
      • NorthWest
      • Gauteng
      • Mpumalanga
      • Limpopo
    • South Africa's Economic Structure
    • South Africa's Economic History
    • South Africa's Trade Data Page
    • South Africa's Food and Beverages Sector
    • Financial Well-being of South African Companies_2015
    • SA vs the World
    • Budget Day Page (24 Feb 2016)
  • Stock in Focus
    • JSE ALSI Chart
    • Sector Comparison Page
    • JSE-Calendar-Tracker-2019
    • Adcorp (ADR)
    • Amazon (AMZN)
    • Apple (AAPL)
    • Ascendis (ASC)
    • AVI (AVI)
    • Bidvest (BVT)
    • Blue Label Telecoms (BLU)
    • Bowler Metcalf (BCF)
    • Capitec (CPI)
    • City Lodge Hotel Group
    • Clicks Group (CLS)
    • Coronation (CML)
    • Curro Holdings (COH)
    • Discovery (DSY)
    • Distell (DST)
    • EOH (EOH)
    • Famous Brands (FBR)
    • Ferrari (RACE)
    • FirstRand Group (FSR)
    • Grindrod (GND)
    • GrowthPoint (GRT)
    • Holdsport (HSP)
    • Harley-Davidson (HOG)
    • Hyprop (HYP)
    • Hyprop (HYP)_1Jun2016
    • Investec Property Fund (IPF)
    • JSE (JSE)
    • Massmart (MSM)
    • MediClinic (MEI)
    • MTN (MTN)
    • MTN (MTN)_May2016
    • Mr Price Group (MRP)
    • Mr Price Group (MRP)_8APR2016
    • Nedbank (NED)
    • OneLogix (OLG)
    • Peregrine Holdings (PGR)
    • Pick 'n Pay Stores (PIK)
    • Pioneer Foods (PFG)
    • PSG Group (PSG)
    • Quantum Foods (QFH)
    • RCL Foods (RCL)
    • Remgro (REM)
    • Richemont (CFR)
    • RMB Holdings (RMH)
    • Rolfes (RLF)
    • Sanlam (SLM)
    • Sasol (SOL)
    • Sasol (SOL)_18sep2016
    • Santova (SNV)
    • Spar Group (SPP)
    • Shoprite Holdings (SHP)
    • Spur Corporation (SUR)_7Sep2017
    • Standard Bank (SBK)
    • Steinhoff International Holdings (SNH)
    • Stor-Age (SSS)
    • Super Group (SPG)
    • Taste Holdings (TAS)_30May2016
    • The Foshini Group (TFG)
    • Value Logistics (VLE)
    • Vodacom (VOD)
    • Wilson Bayly Holmes Ovcon (WBO)
    • Woolworths (WHL)
    • Woolworths (WHL)_24Aug2017
    • Zeder (ZED)
  • Online Calculators
    • Rand Petrol Price Estimator
    • Share Valuation
    • Financial Ratios Calculator
    • GDP Growth Estimator
    • Future Value of Investment Calculator
    • Loan repayment calculator
  • Contact
  • About
  • Search