|
Related Topics |
|
In today's blog we take a look at South Africa's producer inflation for food and food related products and compare the producer price inflation for food and related products and compare it to consumer price inflation levels for food and food related products.
|
|
PPI vs CPI
The line graph below shows the producer inflation levels for various food and food related products in the PPI while comparing it to the overall PPI for final manufactured goods in South Africa. And as can be seen from the line graph a few items have shown significant declines in recent months, the question is whether these declines in producer inflation levels filters through to the consumer inflation levels. If consumer inflation levels do not show corresponding declines in prices, then we can assume that retailers are keeping the prices high or constant and the declines in input costs are then not passed on to the consumers, leading to fatter margins for the retailers. If similar declines are shown in consumer prices, then retailers are passing on the saving to consumers. But this will be looked at later on in the article.
Readers will notice that a number of the food and related series is pretty volatile, while the overall producer inflation (Final Manufactured Goods) is far less volatile and a lot more stable when looking at the year on year growth rates. Law of numbers at play here, the more series are added into the Final Manufactured goods the more stable it will be as series that shows strong increases will be offset by those showing strong declines. The next part of the article will compare some of the food and related products in the PPI to their CPI counterparts to see if they behave in similar fashion. Or whether the pricing behaviour of the two series are markedly different.
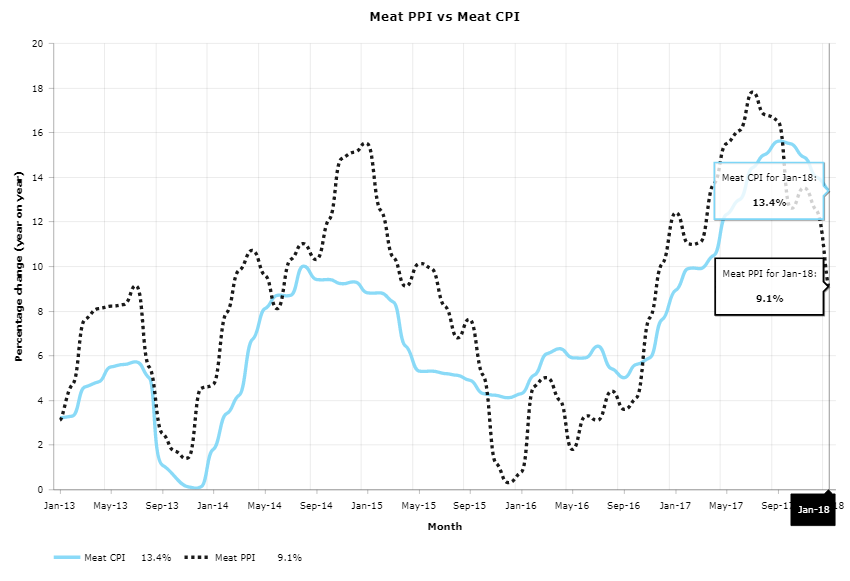
PPI Meat vs CPI Meat
The graphic below compares the producer inflation in meat products to that of the consumer inflation in meat products.
The image above shows that the movement between meat price inflation for producers and that of consumers are very very similar. While the level of price movements for the producers are more volatile, the trends are very similar between the inflation experienced by meat producers and the rate of inflation experienced by consumers when they buy the meat products in retail stores.
Average meat producer inflation over the period January 2013 to January 2018 was 8.6% while the average meat consumer inflation over the same time period was 7.1%. Thus showing that producers of meat is struggling to pass on their inflation to the consumers as the inflation experienced by the consumers are far less than that of the producers.
Average meat producer inflation over the period January 2013 to January 2018 was 8.6% while the average meat consumer inflation over the same time period was 7.1%. Thus showing that producers of meat is struggling to pass on their inflation to the consumers as the inflation experienced by the consumers are far less than that of the producers.
Fruits and Veg PPI vs Fruit and Veg CPI
In a reversal of fortunes, in the graphic above, the producer inflation for fruits and veg is far more stable than the consumer inflation levels for both fruits and vegetables. Interestingly the consumer inflation for fruit is more volatile than that of vegetables. One would have assumed that they move in very similar fashions as both products have very similar input costs and crop yields, storage, pesticides etc are very similar for these two items.
Since January 2013, the average level of inflation for fruits and veg for producers are 6.5%, while the average level of consumer inflation experienced over the same period was as follows:
Fruits: 5.7%
Veg: 7.1%
Since January 2013, the average level of inflation for fruits and veg for producers are 6.5%, while the average level of consumer inflation experienced over the same period was as follows:
Fruits: 5.7%
Veg: 7.1%
Grain mill products PPI vs Breads and cereals CPI
The graphic below shows the producer inflation for grain mill products vs the consumer inflation levels for breads and cereals. While the trends in inflation between the grain mill products PPI and breads and cereals CPI are very similar, the magnitude of the price movements are significantly different.
The average rate of inflation for grain mill products PPI over the period January 2013 to January 2018 was 4.4% while the breads and cereals CPI over the same period was 7%. The decline in the grain mill products PPI in recent months has been far more significant for the producers than for the consumers. In the above case it looks like retailers are not passing on all the gains due to lower producer inflation onto consumers, thus the retailers taking a bit of meat off the bone and pushing up their profit margins a bit with this product group.
What is interesting to note with the above graphic is that it looks like there is a clear "lag" or time delay between the PPI price movement and the CPI price movement. With the CPI movements tracking the PPI movements of a few months earlier. For example the PPI reached a peak in July 2017 while the same peak was only reached in the CPI in January 2017. And while it looks like the bottom was reached in the PPI in Septemeber 2017, it is yet to reach the bottom in the CPI with the latest CPI month recording a lower level of inflation than the month before . Based on the peaks (there is a 5 month lag) between when the PPI reaches a peak and the corresponding peak in the CPI. We can therefore reasonably assume that the CPI will reach its bottom in the month of February 2018.
What is encouraging to see is that while the magnitude of the price movements between the PPI's and CPI's are different the general direction and trends experienced by both the PPI and the corresponding CPI's are very similar. Which gives confidence to economic modelers to use the producer inflation data to estimate or forecast expected direction and trend of consumer inflation data.
Let us know what you thought of this article: |