|
Related Topics |
|
In today's blog we take at Capitec (CPI) share price performance over the last couple of years and compare that to the performance of the Financial Index (J580) on the JSE.
Capitec has been a market darling over the last 5 to 10 years and has provided shareholders with extraordinary returns over this time period. But in the last month it has been lagging the financial index of the JSE. We take a look below |

Capitec blowing the JSE Financial Index away
|
Capitec blowing the competition away
The interactive share price graphic further down in this article shows the phenomenal share price performance of Capitec over the years, compared to that of the financial index (which includes Capitec and all its major competitors).
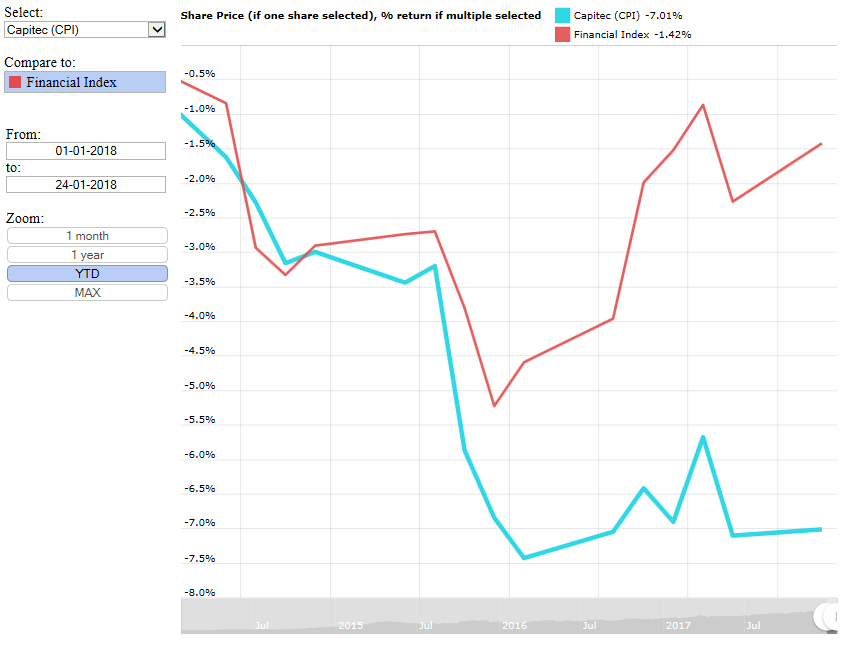
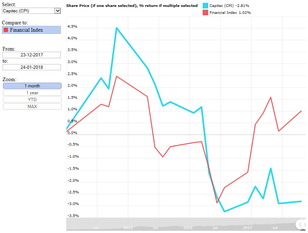
While the growth in Capitec has been extraordinary it has lagged the financial index a tad in the last month. As the images below show. It shows the Year to Date returns of the financial index and Capitec, as well as the performance over the last month (22 December 2017 to 22 January 2018). And as the graphic shows, Capitec's returns have been a little slower than its competitors in the recent past.
Year to Date (YTD) |
Last month |
|
|
As the images above show, Capitec's returns have been lower than that of the financial index Year to date and over the last month. YTD Capitec share price is down just over 7% while the financial index is down just above 1.5%. And over the last month, Capitec's share price has declined 2.8% while the financial index is up by 1.02%.
However when looking at Capitec's share price performance over the last year and over the last 4 years (the span of our interactive graphic), it is clear that Capitec has easily outperformed its peers on the JSE.
However when looking at Capitec's share price performance over the last year and over the last 4 years (the span of our interactive graphic), it is clear that Capitec has easily outperformed its peers on the JSE.
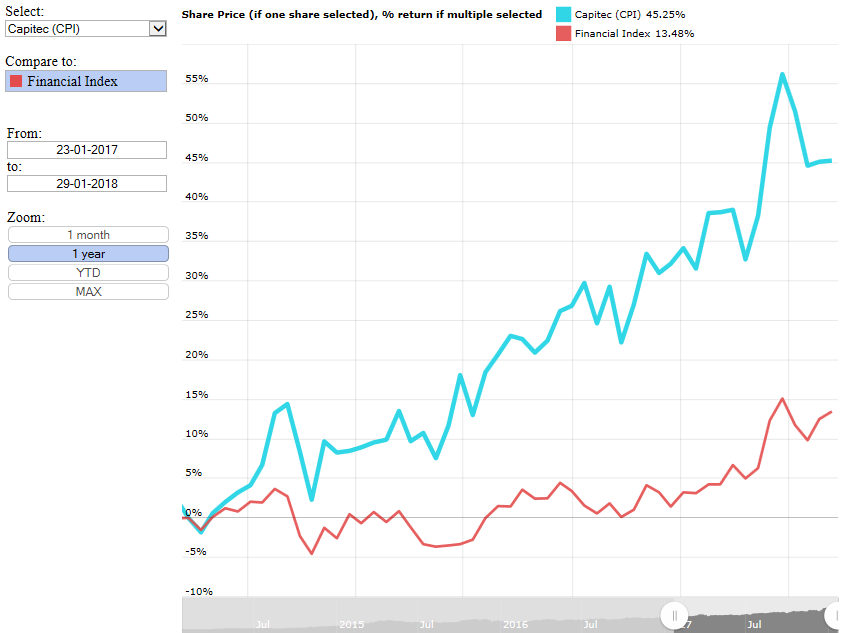
Last 12 months |
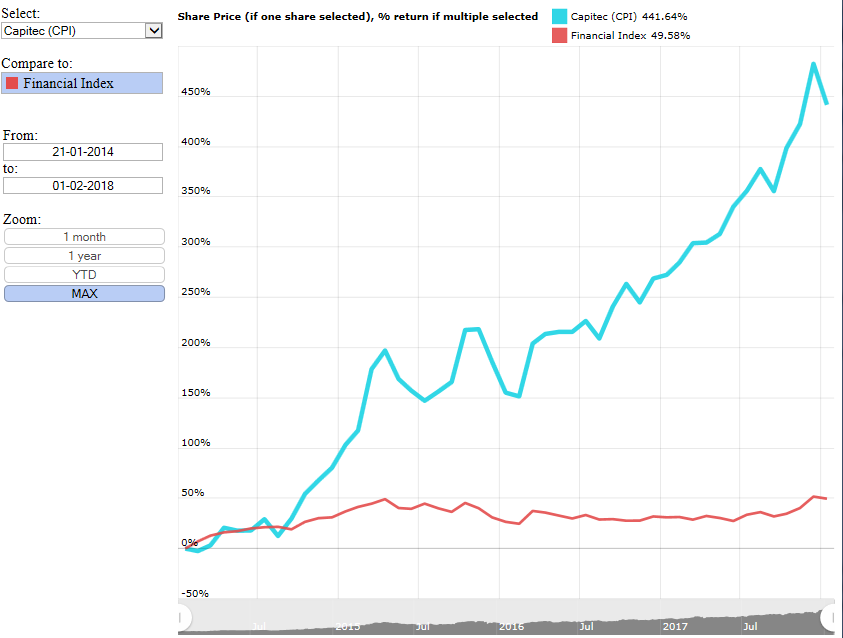
Last 4 years |
|
|
As the two images above show, Capitec's share price performance over the last 12month and last 4 years are far superior to the returns delivered by the financial index of the JSE. Just showing by how much Capitec's share price has outperformed that of its listed peers.
In the last 12months Capitec's share price is up by 45.25% while the financial index only returned 13.48% (Capitec outperforming it by 3 times).
In the last 4 years, Capitec has shown extraordinary growth of 441.64% compare to the financial index's 49.6% return over the same period. The return of Capitec compared to the Financial index is 8.9 times more over the last 4 years. While growth in Capitec's share price is expected to slow over time as their rapid growth starts to ease, it sure has been a brilliant performer over the years and has made its shareholders (including big shareholder PSG Group) exceptional returns.
Interactive Capitec and Financial Index graphic
As users change the dates the graphic will automatically recalculate the return of both Capitec and the financial index of the JSE. We encourage users to play around with the graph. The scroll bar at the bottom of the graphic can be used to select the dates readers would like too.
From the above graphic it is pretty clear that the PE ratio is far greater than the cash generated per share ratio. This is due to the fact that cash generated per share is far higher than actual earnings per share. As earnings reported includes all operating expenses and taxes paid, while cash generated by operations just focuses on the cash generation ability of a company.
For OLG for example, while their reported earnings came in at 29.6c a share, they generated a very healthy R1.20 in cash per share. And with a share price of just R3.20, its PCGPS ratio is exceptionally low. While Bid Corp's PCGPS ratio is far higher than that of OLG, with it sitting at closer to 15.. Thus the cash generated by Bid Corp per share amounts to roughly 6.8% of Bid Corp's share price, whereas for OLG this was sitting 37.5%
Does the CGPS provide a magic pill in determining whether a share is undervalued or not? Absolutely not, but it does provide readers with a good indication of just how cash generative a business is (assuming of course they dont cheat and defraud investors with unreliable financial statements as is the case with Steinhoff).
Let us know what you thought of this article: |